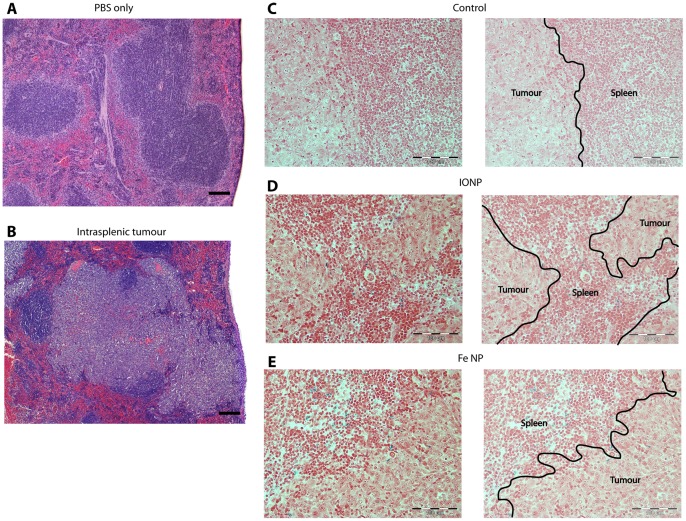
Figure 3. Histology of intrasplenic tumours.
(A) Sections show mouse spleens 72 h after receiving intrasplenic injections of PBS only, or (B), 1×10⁶ 4T1 breast cancer cells. Following intrasplenic injections of tumour cells, mice also received intravenous injections of (C) PBS, (D) IONP or (E) Fe NP. The spleens were removed, fixed and sectioned for light microscopy. An H&E stain was applied in (A) and (B) to show the tumour architecture and a Perl stain was applied in (C-E) which demonstrates the presence of Fe (blue) predominantly in the splenic tissue, and not in the tumours, of mice that received IONP or Fe NP. (scale bar = 100 µm).

