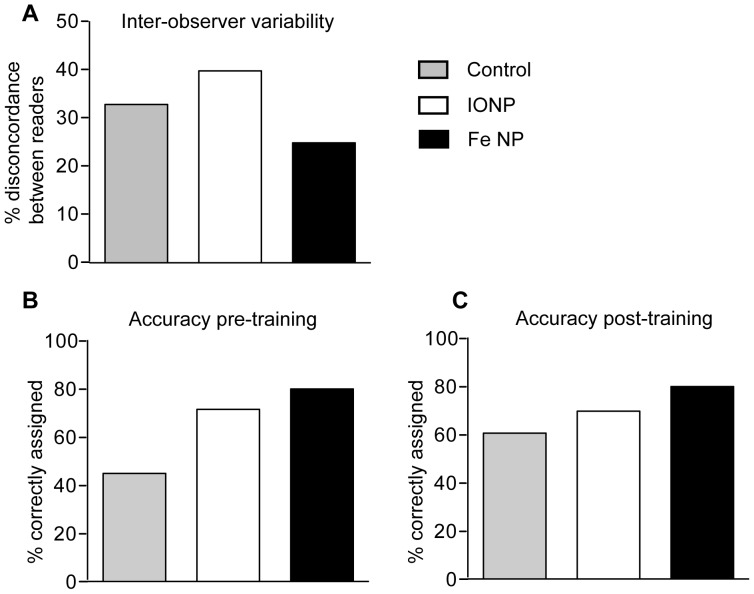
Figure 5. Inter- and intra-observer variability.
(A) The scoring of each mouse was compared between the two radiologists. The variation between the scorings was plotted for each type of contrast agent with the two scores for each mouse defined as variant if they differed by more than one point. After an initial scoring (B), radiologist 1 received training then rescored all the mice (C), with a value of 1–2 considered correct if no tumour was present and 4–5 correct if a tumour was present.

