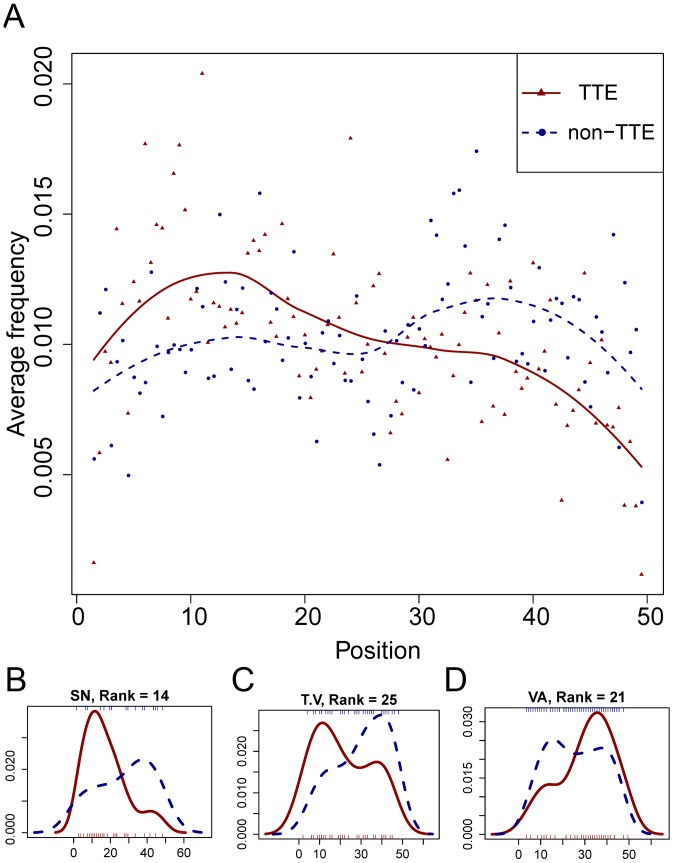
Figure 4. Sequence position distribution of k-spaced amino acid pairs.
(A) Each point represents the overall frequency of the 50 most positively weighted amino acid pairs occurring at the N-terminal sequences from TTEs (red triangle) or non-TTEs (blue circle). Trend lines are drawn using loess smoothing for the points from TTEs (red) and non-TTEs (blue), respectively. (B–D) Position density distribution of pairs [SN], [T.V] and [VA] in TTEs (red solid line) and non-TTEs (blue dotted line). The horizontal axis in (B–D) is the same as in (A).

