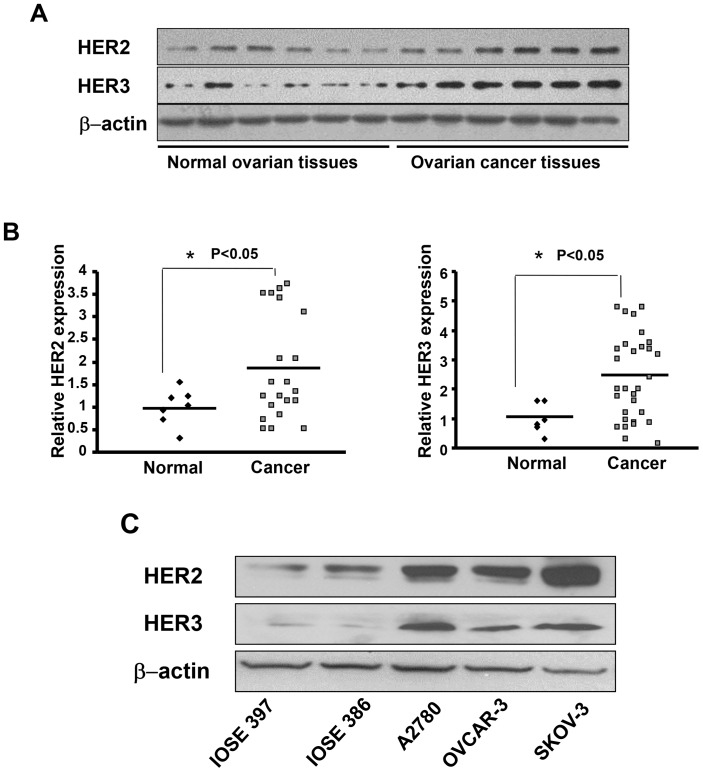
Figure 3. HER2 and HER3 protein expression levels in ovarian cancer tissues.
(A) The protein levels of HER2 and HER3 were evaluated in human ovarian cancer tissues and normal ovarian tissues by immunoblotting (6 representatives HER2 or HER3 positive samples are shown for both groups). The level of β-actin was used as loading control. (B) Scanning densitometry was used to quantify the relative expression levels of HER2 or HER3. The scattered graphs showed HER2 or HER3 expression levels in HER2 or HER3 positive samples in normal tissues and cancer tissues. The values were normalized to the average value of normal tissues. (C) Expression levels of HER2 and HER3 in ovarian cancer cell lines SKOV3, A2780, OVCAR-3, and immortalized ovarian epithelial cell lines IOSE397, IOSE396 were analyzed by immunoblotting.

