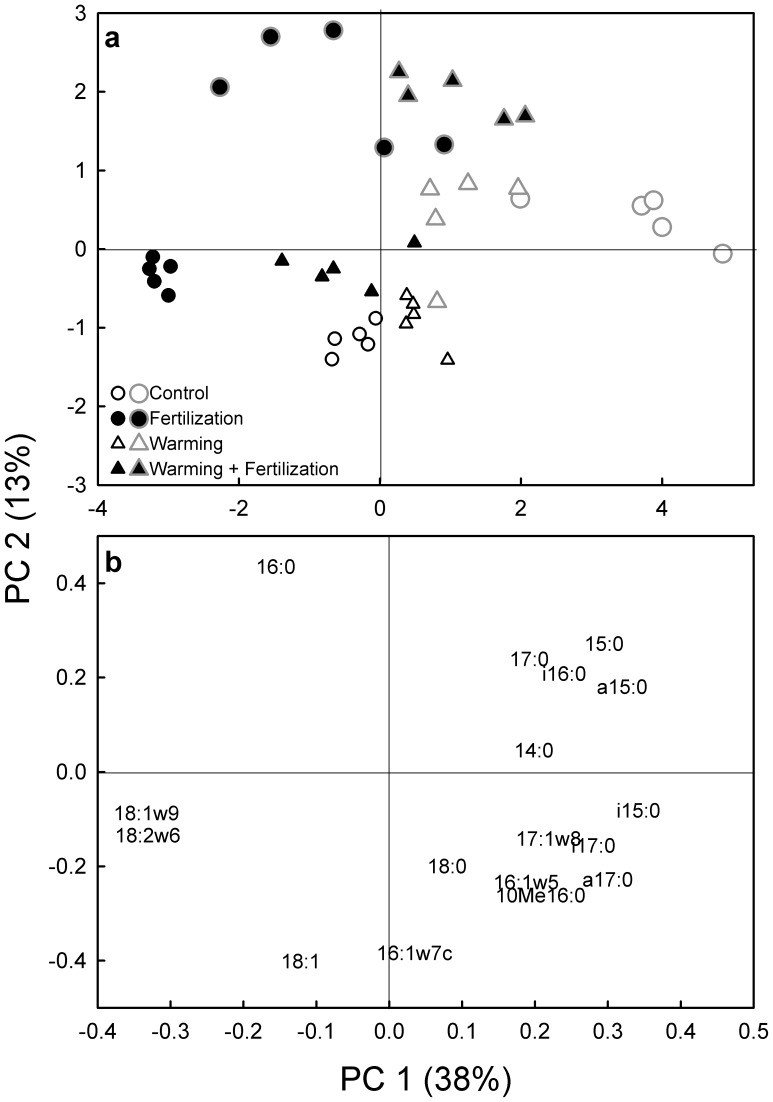
Figure 3. Principal component analysis of the NLFA mole percentage profiles in tundra heath soil from a field experiment with long-term fertilization and warming treatments.
(a) A score plot showing mean values for substrate additions after a 1-day-long incubation (small symbols drawn with black line) and after a 7-day-long incubation (large symbols drawn with grey line). The mean values for all substrates within each treatment (glucose, glycine, acetic acid, starch and vanillin) are marked with similar symbols since the substrate additions did not affect the NLFA pattern. (b) A loading plot showing the individual NLFAs. Variance explained by principal component (PC) 1 and 2 in parentheses. P<0.001 for effects of Fertilization, Time and Warming×Fertilization on the PC scores (Linear Mixed Models with Warming, Fertilization and Time as fixed factors and Block as a random factor).

