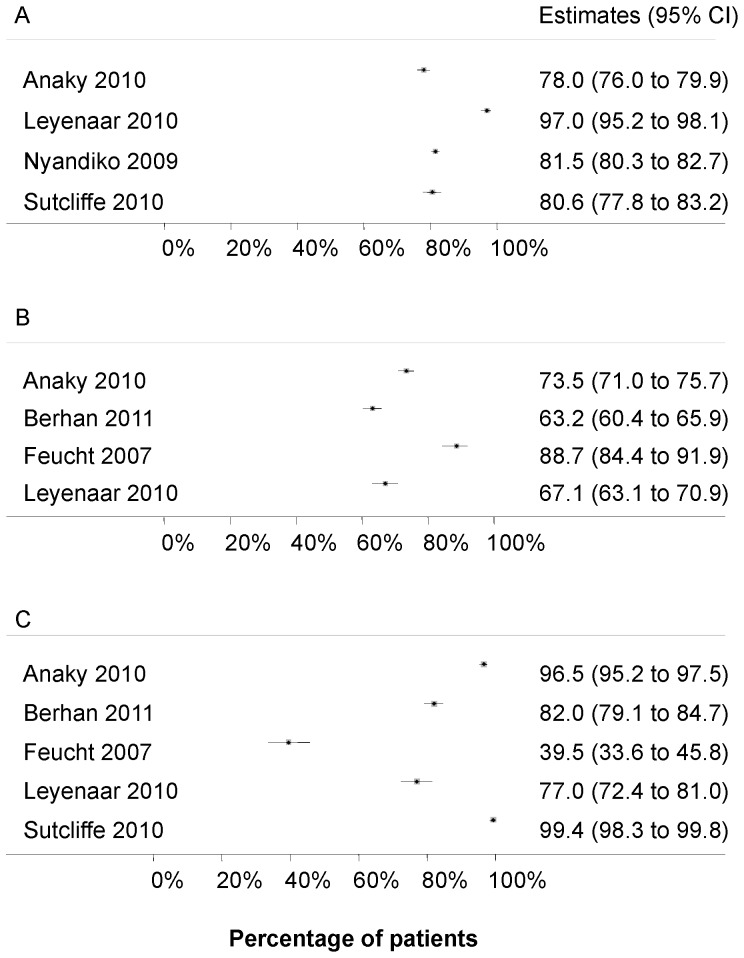
Figure 2. Forest plots – time from HIV diagnosis to start of antiretroviral therapy (ART).
A): Percentage of HIV positive children with a CD4 cell count/percentage. B): Percentage of children with an eligibility assessement who meet eligibility criteria for ART. C): Percentage of ART eligible children starting ART.

