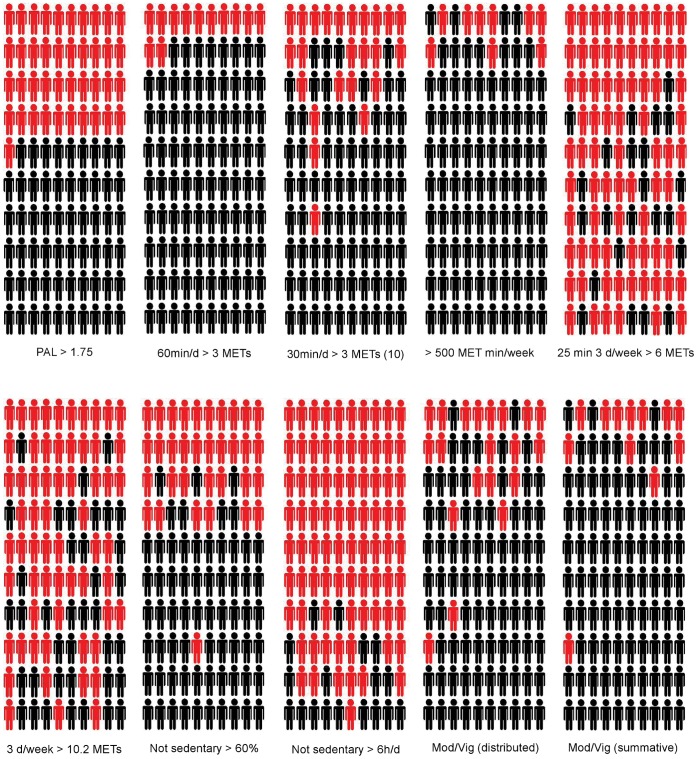
Figure 2. Heterogeneity in physical activity status according to dimension or characteristic.
The data for 100 men is shown in rank order for PAL with each individual retaining their relative position for all other dimensions/characteristics. Red indicates below and black indicates above the defined threshold for each attribute/characteristic.

