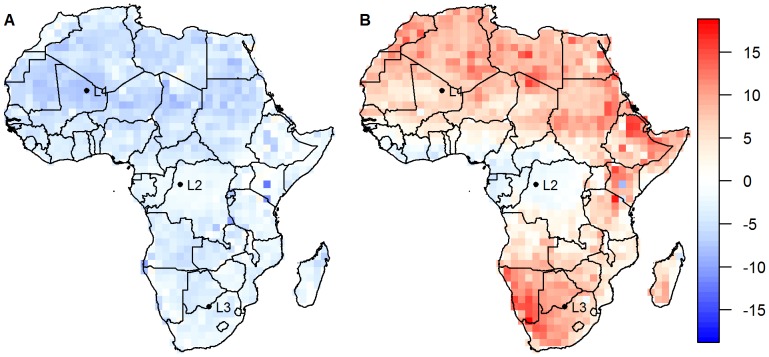
Figure 1. Annual mean differences between observed surface and air temperature during night (left) and day (right).
Locations L1, L2 and L3 at latitudes 19.5, 0, and −25.5 and longitudes 0. 19.5 and 25.5, respectively, give the locations for the time series shown in Figure 2.

