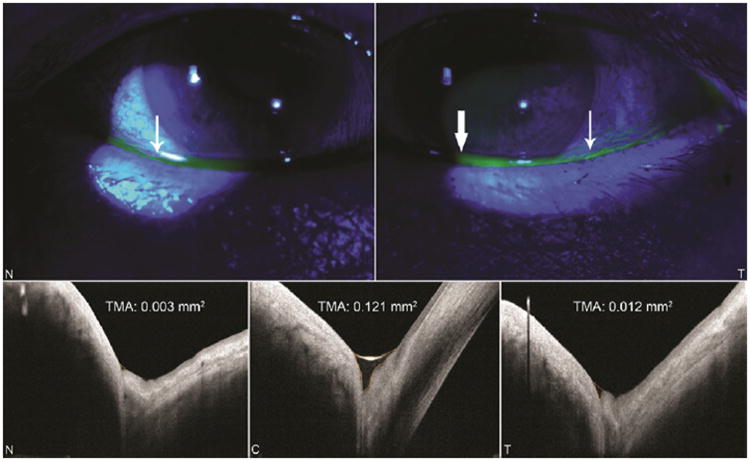
Figure 8.
Digital images of lid margin and ocular surface with fluorescein and cobalt blue filter (Top right and left) and anterior segment optical coherence tomography (AS-OCT) (Bottom right, left, and middle) in the same patient with nasal and temporal conjunctivochalasis. Thin white arrows in biomicroscopic images reveal nasal and temporal disruption of lower tear meniscus and thick white arrow points to central tear pooling. These biomicroscopic findings are consistent with the qualitative and quantitative AS-OCT data. Cross-sectional tear meniscus area (TMA) values are provided in AS-OCT images. (N, nasal; C, central; T, temporal.)

