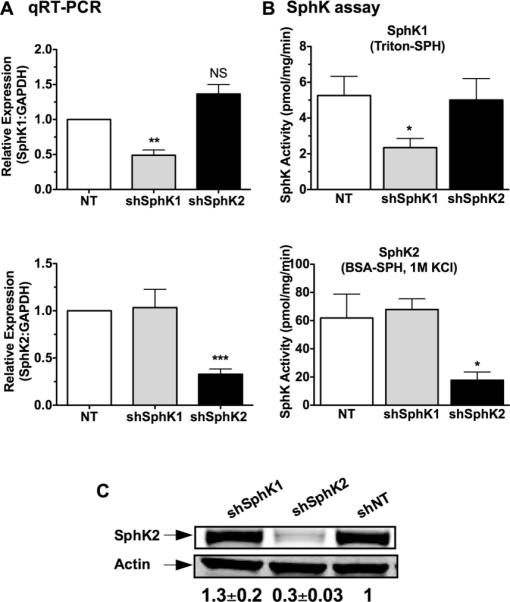
Figure 2. Specific knockdown of SphK1 and SphK2 in rodent mast cells.

MC were transduced with lentivirus containing shRNA sequences specific for SphK1, SphK2, or nontarget (NT) shRNA control. Efficient shRNA silencing of each isoenzyme was determined by real- time PCR (A) or by enzymatic assays (B). (A) Gene expression assays specific for SphK1 (upper panel) and SphK2 (lower panel) were used to determine the relative mRNA levels after shRNA silencing. A specific probe for GAPDH was used as an internal control. Each measurement for SphK1 and SphK2 was normalized to GAPDH (ΔCt) and measurements were then compared to the nontarget (NT) values. (B) Cells transduced with the various shRNA constructs were assayed for SphK1 (upper panel) or SphK2 (lower panel) activities as described in methods. Specific assay conditions allowed for the selective detection of SphK1 activity in the presence of triton-sphingosine micelles and SphK2 activity in the presence of a buffer containing 1M KCl as described in the Methods section. Shown in A and B are results from BMMC; similar results were obtained in PDMC. Data are the average ± S.E. of at least four individual cultures. Statistical significance compared to nontarget control, * P<0.05; **P<0.01, *** P<0.001. (C) Protein confirmation of shRNA-mediated SphK2 silencing by Western blot analysis. Equal protein loading was confirmed using Actin as a loading control and quantified by densitometry. Shown is a representative blot from PDMC lysates out of at least 3 separate experiments; very similar results were obtained in BMMC. The values underneath the blots represent the average densitometry values (n=7 including BMMC and PDMC blots) corrected by actin and normalized to NT control and are expressed as average ± S.E.
