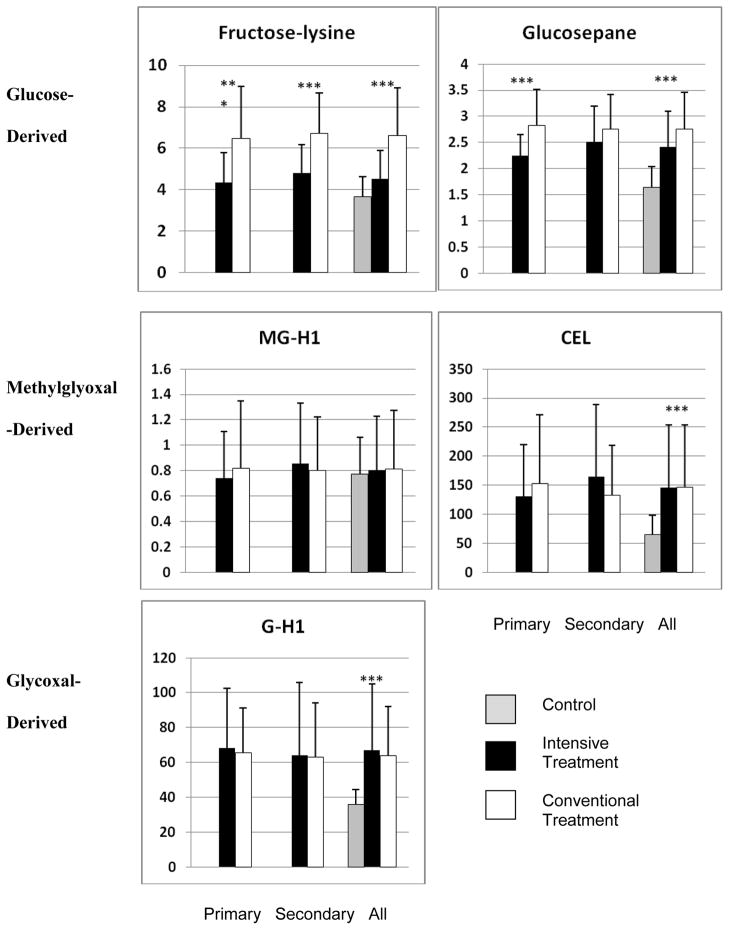
Figure 1.
Effect of intensive glycemic control on skin collagen levels of glycation products by primary, secondary cohort and overall, grouped according to source of precursor carbonyl compound. Grey bar: non-diabetic controls, black bar: DCCT intensive treatment group, white bar: DCCT standard treatment group. All the asterisks in Fig. 1 indicate P < 0.0001.

