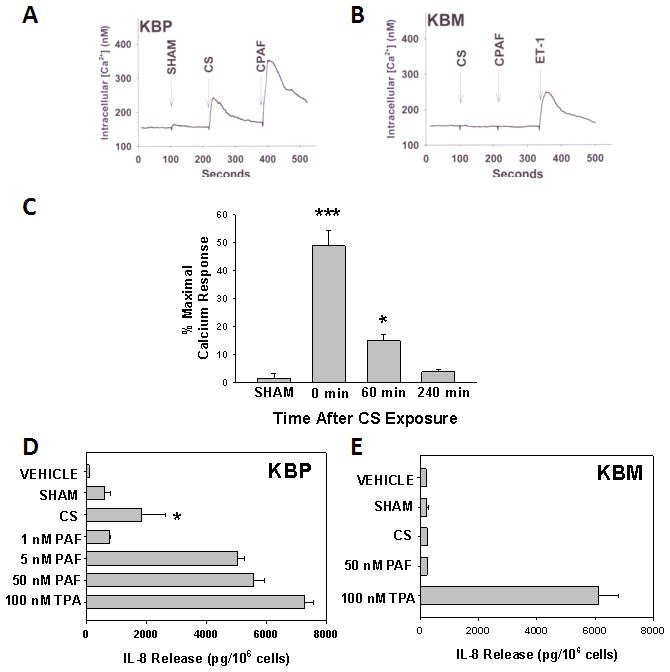
Figure 1. Identification of PAF-R agonistic activity in blood from CS-treated mice.

Lipid extracts from pooled whole blood from groups of 3–4 female mice (approx 2 ml total for each sample) were taken immediately (time 0) or various times following 5h of cigarette exposure, versus sham-treated mice. 25% of the sample (0.5 ml blood) from time = 0 was added to A) KBP cells or B) KBM cells loaded with FURA-2 dye and fluorescence monitored with spectrophotofluorimeter, and converted to intracellular Ca2+ levels. Excess (1 μM) CPAF or ET- 1 was added at the end of the incubation as positive control. C). Time course of PAF-R agonist measurement. Lipid extract-induced Ca2+ mobilization responses (from 0.5 ml of pooled blood) are expressed as a percentage of the maximal response elicited by CPAF (1μM) in KBP cells. The data are mean ± SE % maximal (CPAF) response at time = 0 from at least 4 pooled samples at each time point. D) KBP or E) KBM cells were incubated with various concentrations of PAF, 100 nM of the phorbol ester TPA or lipid extracts from blood taken 1h following sham- versus CS-exposed mice (as in Figure 1C). After 6h, the supernatants were removed and IL-8 measured by ELISA. The data are mean ± SD IL-8 protein from at least 3 pooled samples. Statistically significant (* = p < 0.05 & *** = p <0.0001) differences from vehicle-treated CS PAF-R agonist formation measurements.
