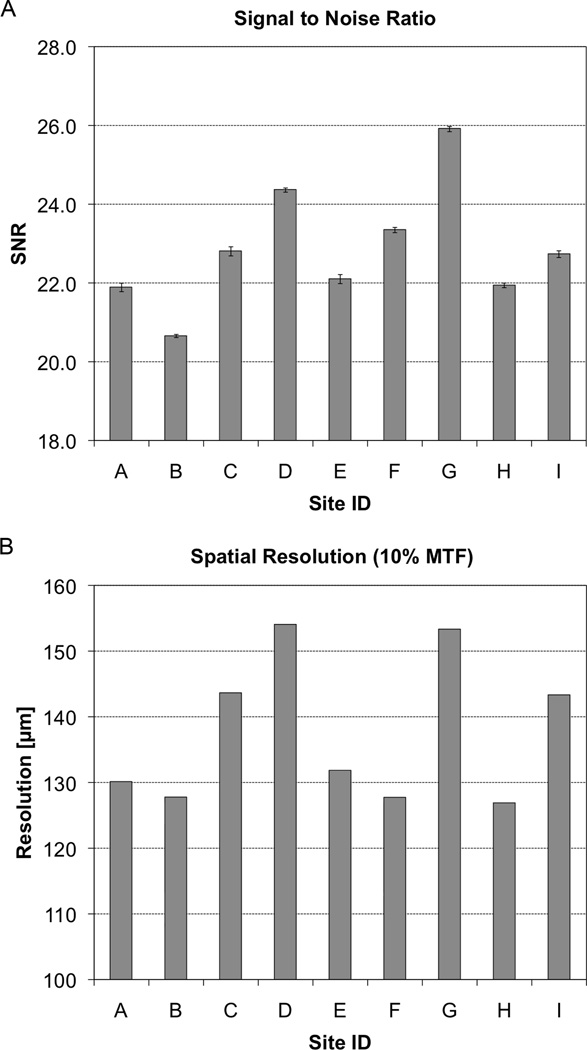
Figure 4.
The noise and spatial resolution of the individual HR-pQCT systems from the nine imaging centers participating in this study is presented in bar graph form. Above (A) the noise performance is characterized by a simple SNR measurement in the standard QC density phantom with error bars indicating the standard deviation of SNR for three repeat scans. Below (B), the spatial resolution is estimated to be the spatial frequency corresponding to the 10%-height of the modulation transfer function (MTF).

