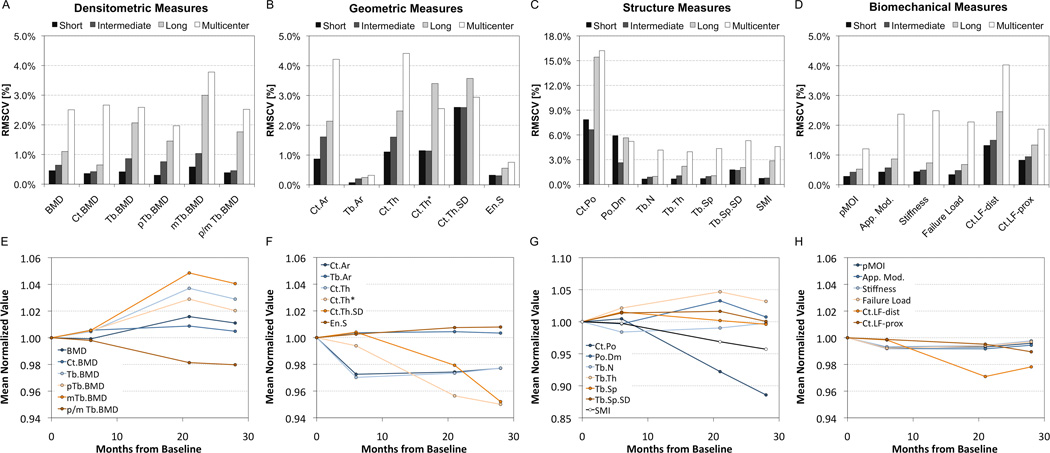
Figure 6.
On top (A–D) are summary bar graphs of the reproducibility of select HR-pQCT measures expressed as RMSCV [%] over short- (<72 hours), intermediate- (3–5 months), and long-term (28 months) for single centers (black, dark grey, light grey, respectively) compared to the multi-center reproducibility of nine different systems (white). On the bottom (E–H) are line graphs illustrating the stability of select HR-pQCT measures monitored at a single site over the course of 28 months. All values were normalized to the baseline for visualization purposes.

