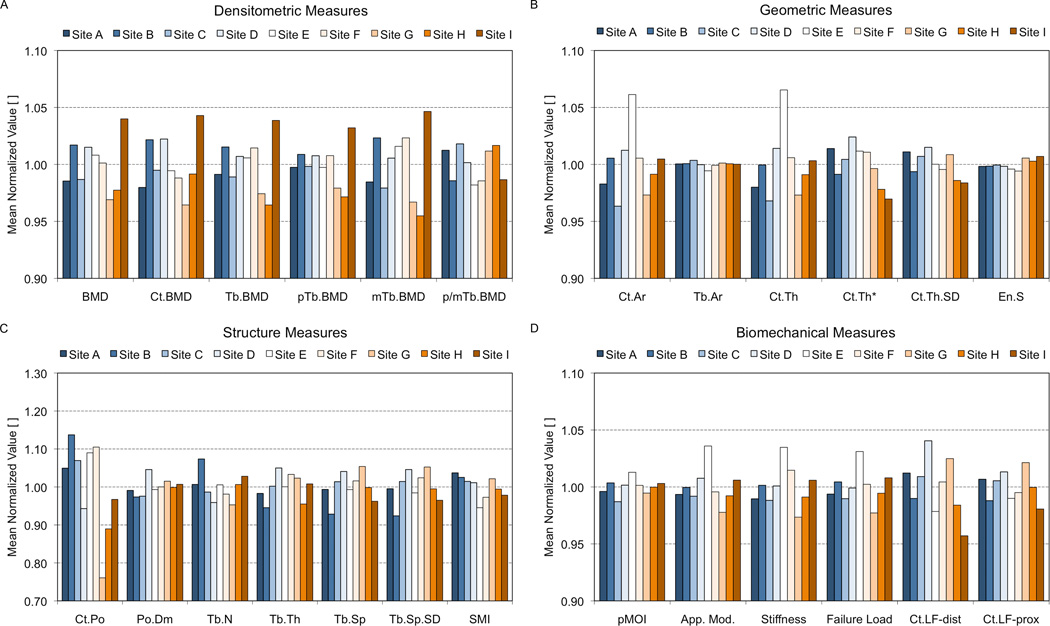
Figure 7.
The comparability of individual imaging systems is illustrated in this figure for the standard density (A), geometric (B), microstructural (C), and biomechanical (D) parameters. For each parameter the value measured for each 1-cm bone section was normalized to the mean value of that section across all nine systems. These graphs represent the mean normalized value for each parameter at a given center.

