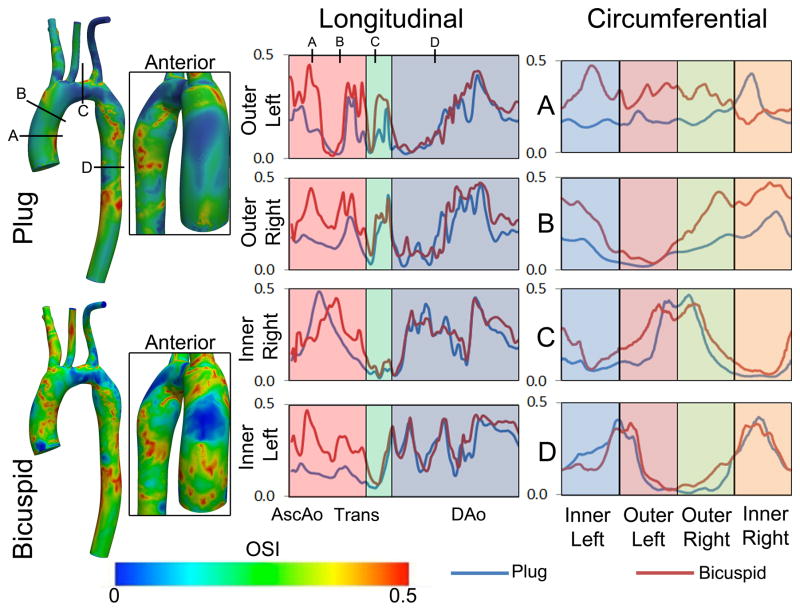
Figure 10.
Comparison of OSI between a plug and bicuspid aortic valve inlet velocity profile for the CoA patient in example 2. Spatial distributions of OSI are shown on the vessel (left) and the inserts show the distribution along the anterior wall. Longitudinal and circumferential OSI were queried at specific locations to quantify region of disparity between inlets.

