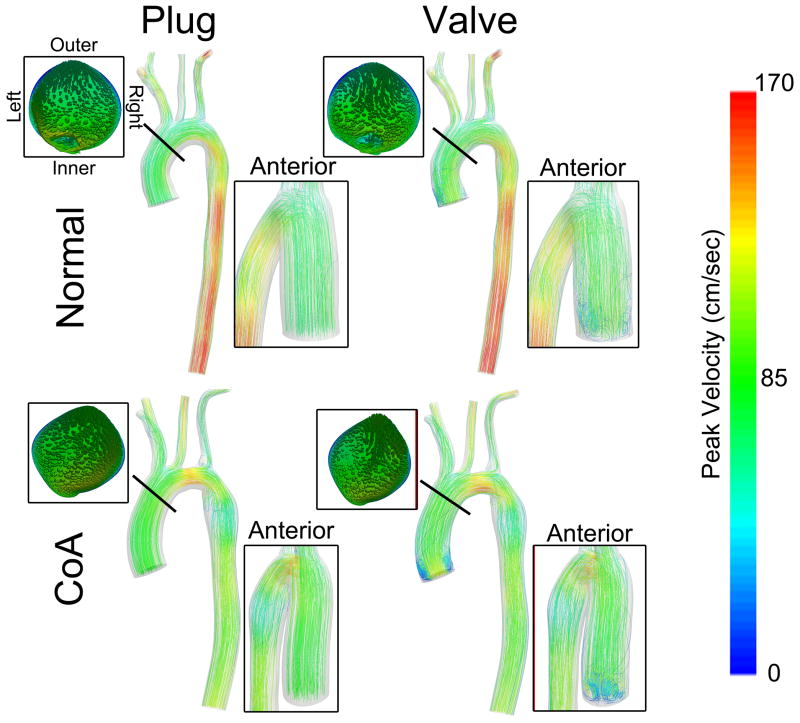
Figure 3.
Blood flow velocity streamlines at peak systole for simulations run with plug (left column) or valve (right column) inlet conditions. Results from the normal patient in example 1 are shown along the top row while results from the CoA patient with a BAV from example 2 are shown along the bottom row. Inserts reveal velocity profiles and associated vectors in the ascending aorta downstream of the valve leaflets.

