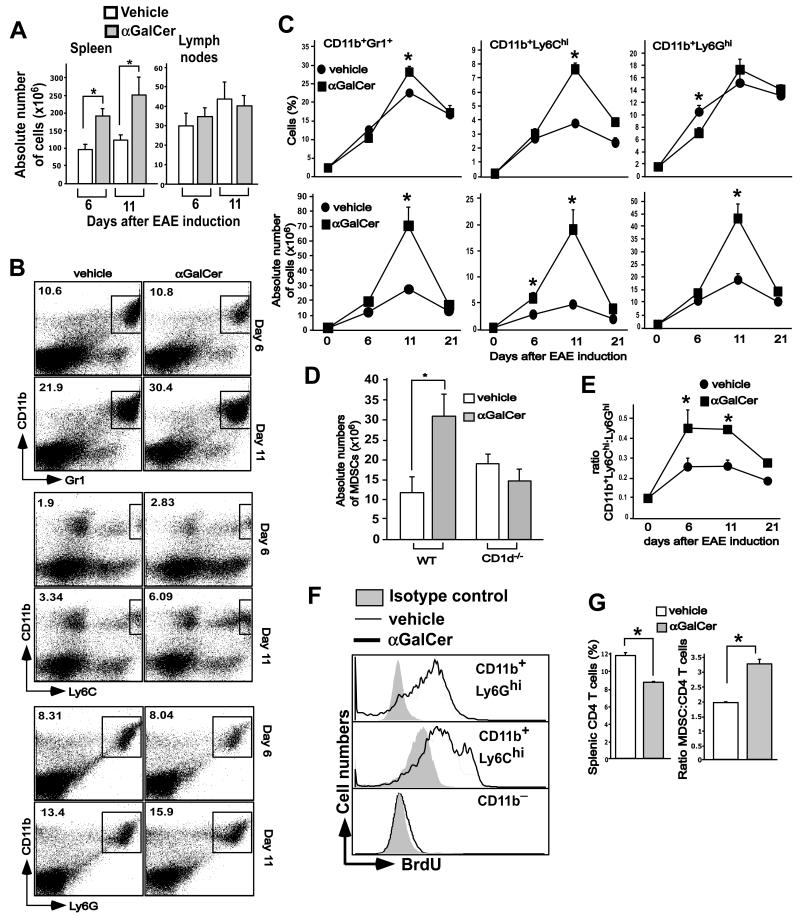
FIGURE 2.
α-GalCer-mediated expansion of MDSCs in EAE-induced mice. B6 mice were induced with EAE and treated with vehicle or α-GalCer. (A) Splenic and lymph node cellularity in vehicle- or α-GalCer-treated mice induced for development of EAE. B6 mice were induced with EAE and treated with vehicle or α-GalCer. At the indicated times the cellularity of spleen and lymph nodes was determined. The data presented are the mean ± SEM of 6 mice per group and representative of at least 3 individual experiments. *p<0.05. (B) At the indicated times after EAE induction, splenocytes were stained with anti-CD11b and -Gr1 antibodies, or with anti-CD11b, -Ly6G and -Ly6C antibodies, as indicated. CD11b+Ly6GhiLy6C− cells represent G-MDSCs and CD11b+Ly6G−Ly6Chi cells represent M-MDSCs. (C) The absolute numbers of CD11b+Gr1+ MDSCs, CD11b+Ly6Ghi G-MDSCs and CD11b+Ly6Chi M-MDSCs were determined based on splenic cellularity. *p<0.05. (D) Absolute numbers of MDSCs in wild-type and of MDSCs in wild-type and mice at day 11 after EAE induction. *p<0.05. (E) The ratio of absolute numbers of CD11b+Ly6Chi M-MDSCs to CD11b+Ly6G+ G-MDSCs was calculated at various time points after EAE induction. *p<0.05. (F) BrdU was injected in mice starting from day 7 after EAE induction, twice a day for two days. The cells were stained with anti-CD11b, -Ly6G and -Ly6C antibodies followed by staining with anti-BrdU antibody or its isotype control antibody. Representative plots of 3 independent experiments are shown. (G) Percent of CD4+ T cells and the ratio of MDSCs to CD4+ T cells are depicted. The results are plotted as the mean ± SEM of 6 mice and are representative of 5 independent experiments. *p<0.05.

