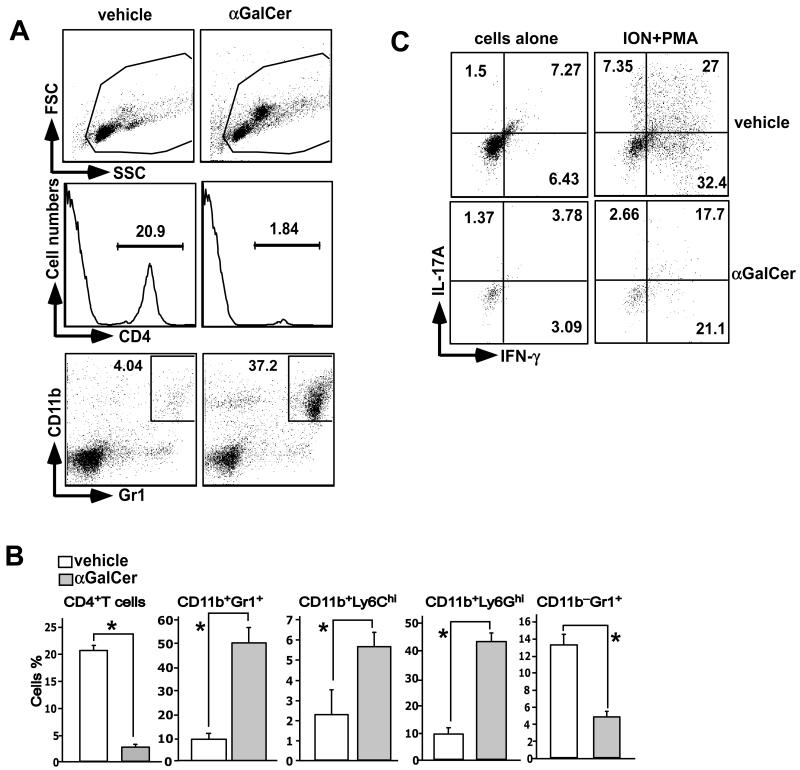
FIGURE 3.
Infiltration of MDSCs and CD4 T cells into the CNS. B6 mice were induced with EAE, treated with vehicle or α-GalCer, sacrificed 21 days later, and cells infiltrating the spinal cord were isolated. (A,B) Cells were stained with anti-CD4 antibodies, anti-CD11b and -Gr1 antibodies, or anti-CD11b anti-Ly6G and -Ly6C antibodies. Representative data are shown in (A). Note the change in the scatter profile of cells isolated from α-GalCer-treated mice (top panels), which is predominantly due to infiltration of MDSCs. A summary of the percentage of cells from 6 individual mice from 3 independent experiments is shown. *p<0.05. (C) Cells were stimulated with ionomycin (ION) plus PMA in the presence of Golgi Plug™ for 5 hrs. The cells were then surfaced-stained with anti-CD4 antibody followed by intracellular staining with anti-IL-17A and -IFN-γ antibodies. A representative of 3 experiments is shown.

