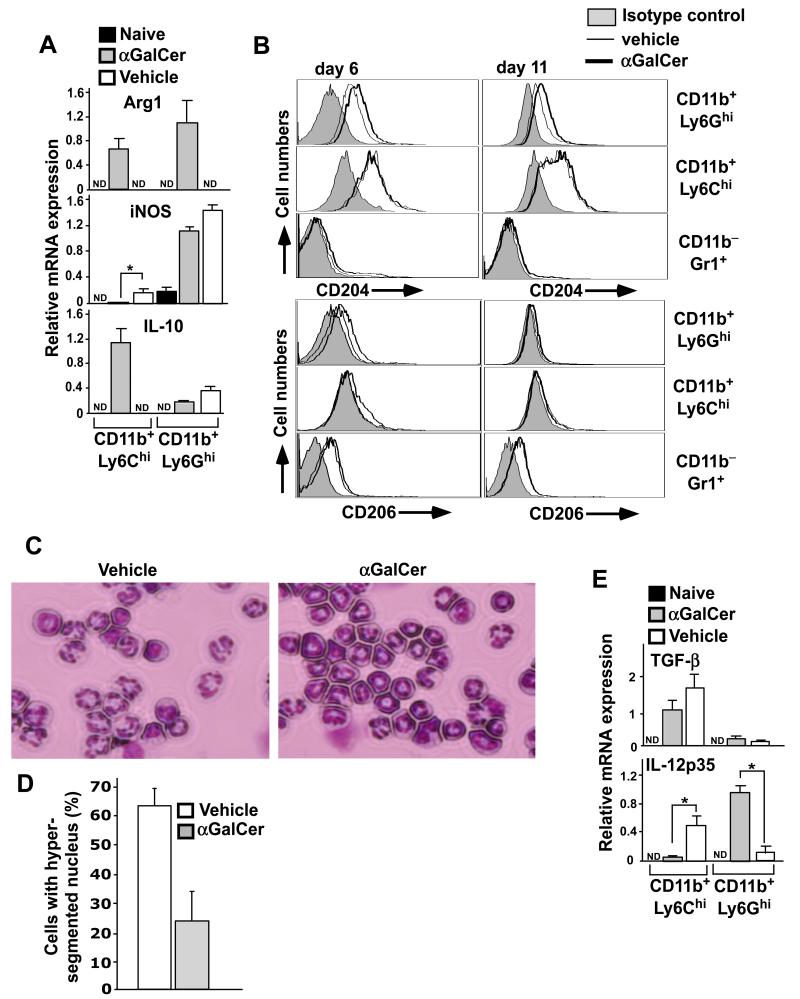
FIGURE 6.
Expression of anti-inflammatory proteins by MDSCs from α-GalCer-treated mice. (A) At day 11 after EAE induction, G- and M-MDSCs were enriched by preparative flow cytometry and RNA was prepared. Relative mRNA levels of Arg1, iNOS and IL-10 were measured by real-time PCR assay. The mean ± SEM of 4 mice is shown. *p<0.05; ND, not detected. (B) At day 6 and 11 after EAE induction, splenocytes were stained with different combinations of anti-CD11b, -Gr1, -Ly6G, -Ly6C, -CD204 and -CD206 antibodies. Representative plots are shown from a total of 6 individual mice from two independent experiments. (C) G-MDSCs enriched from vehicle- or α-GalCer-treated mice were cytospun on slides, stained with HEMA3 staining kit and the nuclear morphology was examined (magnification: 40×). (D) Cells were prepared as in (C) and the number of cells containing hypersegmented nuclei was counted manually and plotted as percent of cells. Nearly 50 cells were counted from randomly chosen fields and a total of at least 300 cells were counted from each mouse. The data presented are the mean ± SEM of 2 mice and representative of 4 mice in each group. (E) Relative mRNA levels of IL-12 p40 and TGF-β were measured by real-time PCR assay as in (A). The mean ± SEM of 4 mice is shown. *p<0.05; ND, not detected.

