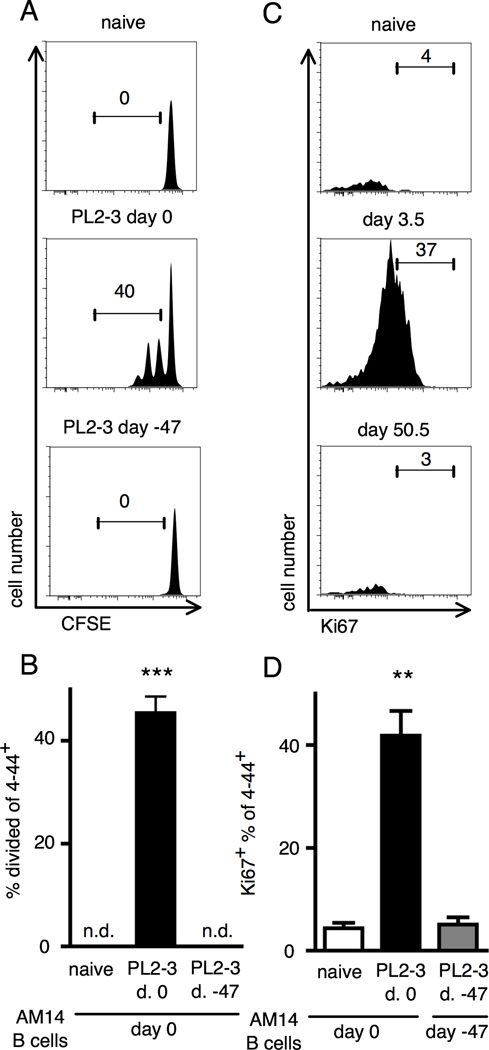
Figure 2. Analysis of residual Ag and proliferative state of residual RF B cells 47 days after initial challenge.
(A) Splenocytes were analyzed by flow cytometry from BALB/cJ mice at day 1.5 after transfer of CFSE labeled B cells. Mice were given either nothing, one injection of PL2-3 at day 0, or 3 injections of PL2-3 starting at day -47. Representative plots of 4–44+ cells are shown with CFSE staining on the x-axis. Gates and numbers show percentages of the parent gate (live 4–44+ B cells). (B) Compiled data from at least 6 mice per group and three independent experiments. n.d. = no division observed. (C) Splenocytes were analyzed by flow cytometry from BALB/cJ mice at day 3.5 or day 50.5 after transfer of AM14 sd-Tg B cells and activation by PL2-3 as described in Materials and Methods. Representative flow cytometry plots showing live 4–44+ B cells with Ki67+ staining on the x-axis. (D) Compiled data from at least 5 mice per group and two independent experiments. Bars represent the mean + SEM. **p < 0.01 and *** p < 0.001 by Mann-Whitney two-tailed test.

