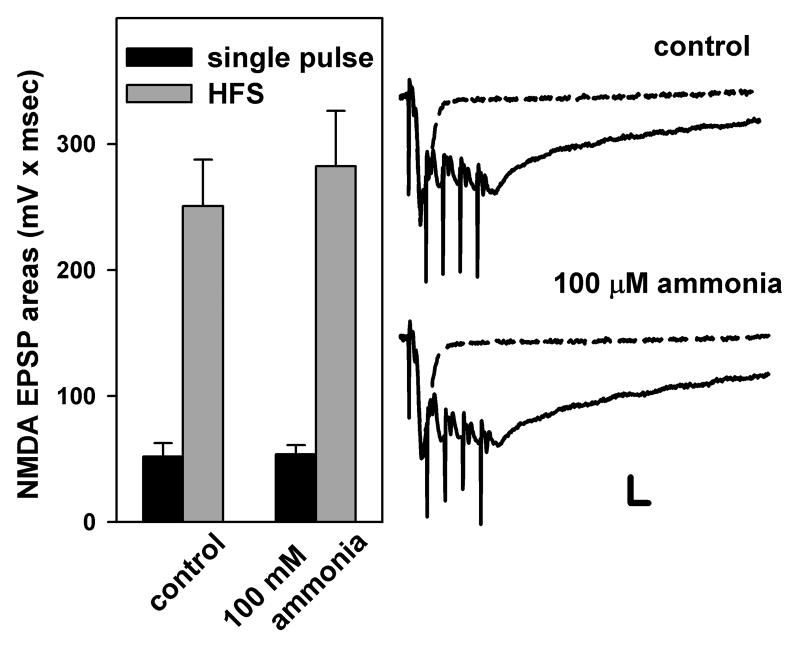
Fig. 2.
NMDAR-mediated EPSPs evoked by single pulse and HFS. NMDAR-mediated EPSPs were elicited by single pulses (black bars in histogram and dotted traces) or by trains of 5 pulses at 100 Hz (grey bars in histogram and solid traces). EPSP areas were measured before and after administration of 100 μM ammonia. Dashed traces depict NMDAR-mediated EPSPs elicited by single pulses, while solid traces show NMDAR EPSPs activated by brief trains of stimulation at 100 Hz. Scale; 1mV, 10 msec.

