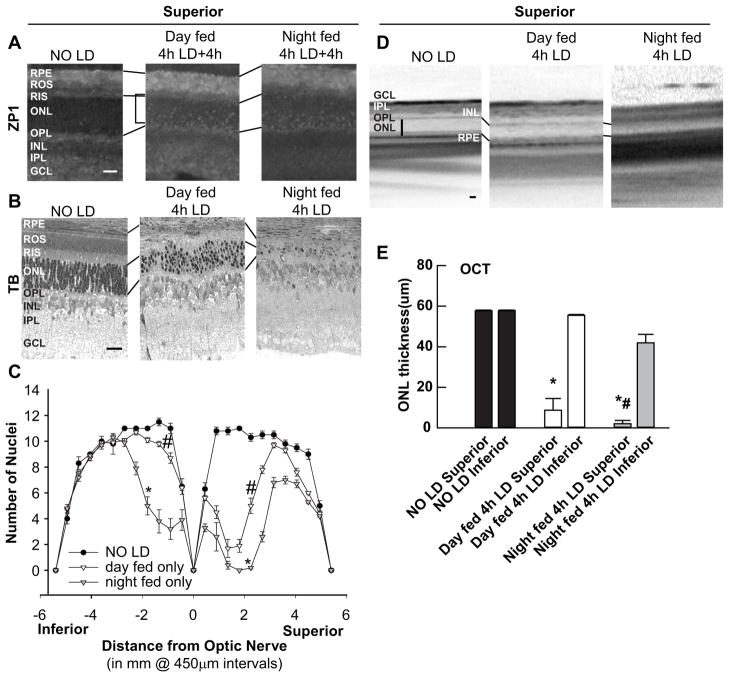
Figure 2. Light-induced retinal damage was attenuated by feeding cycle inversion.
A. LD was performed on rats being fed a normal diet at the times indicated and analyzed 4 h after LD. Zn2+ accumulation was assessed by ZP1 staining (white regions). Photomicrographs of identical exposure were taken of the mid superior regions of the retina. B. Sister retinas were analyzed by plastic sectioning 7d after 4h of light damage. Eyes were cut along a superior to inferior meridian encompassing the optic nerve. Photomicrographs were taken of the mid superior regions of the retina. C. ONL nuclei were counted at increasing distance from the optic nerve, and were averaged and plotted as a function of distance from the optic nerve for each of the experimental conditions (n=6). D. Representative ONL images of central superior were taken from OCT. Vertical bar shows the distance measured. E. The mean thickness of OCT measurement in central superior and inferior hemispheres of the retina in microns. * indicates difference from control, and # indicates difference from light damage at P < 0.05 by one-way ANOVA and a Student t-test. Layers are as marked. Horizontal bar indicates 25 microns.

