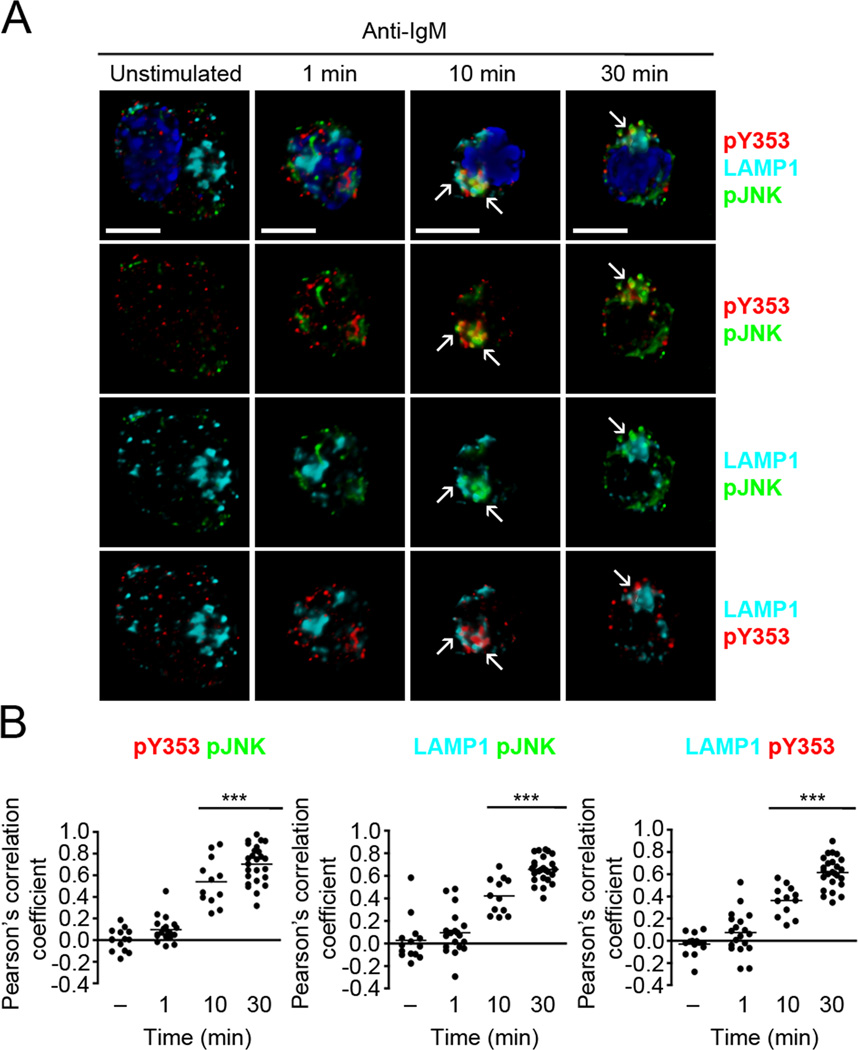
Figure 9. Y353-phosphorylated ezrin and active JNK remain co-localized in late endosomes.
(A) CH27 B cells were stimulated with 10 µg/ml of anti-IgM for the indicated times and stained for pJNK (green), pY353 (red), LAMP1 (cyan) and nucleus (blue). Volumetric renditions of representative cells from each time of stimulation are shown, with arrows pointing to overall and pairwise co-localization between Y353-phosphorylated ezrin, pJNK and LAMP1. Scale bar, 10 µm. (B) Pearson’s co-localization coefficients for the indicated pairs. Each dot represents an individual cell and horizontal lines indicate the mean (n=15–20 per group). Statistical significance is shown for the indicated stimulated groups in comparison to the unstimulated group.

