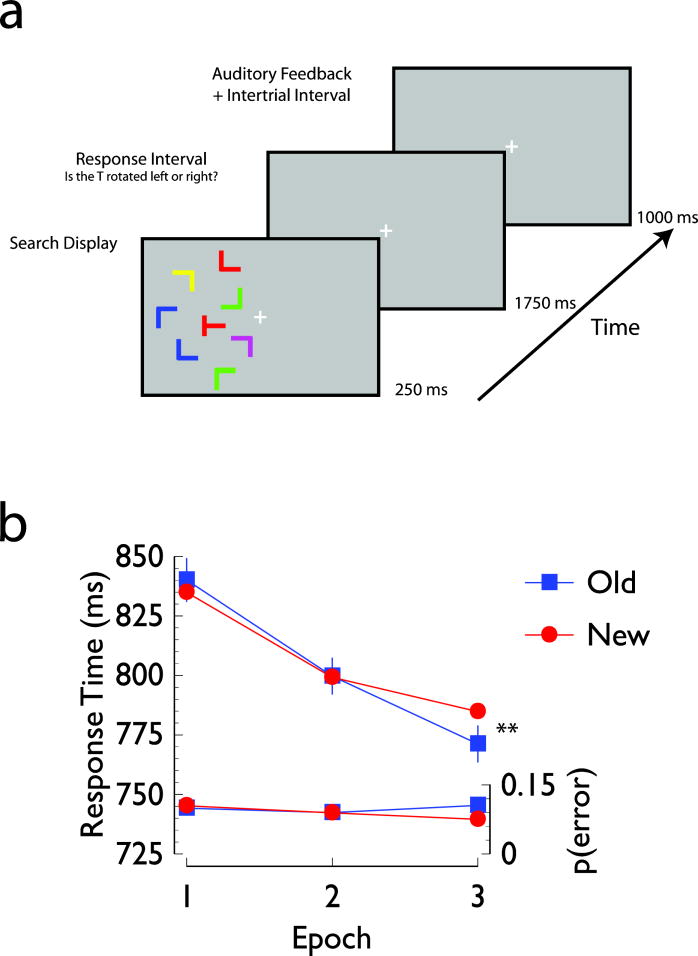
Figure 1. Experimental task and behavioral results.
Panel A: Sample trial sequence. Each trial began with a 250 ms presentation of a search display, followed by a 1750 ms response interval in which participants indicated whether the target letter T was rotated 90° to the left or 90° to the right. After the response, a feedback tone was presented for 250 ms, followed by a 750 ms inter-trial interval. Panel B: Mean response times (upper two lines) and error rates (lower two lines) as a function of display type and experimental epoch. In this and subsequent figures, error bars for each epoch represent one standard error of the mean difference between Old and New conditions, * denotes differences between conditions significant at p<0.05, one-tailed, and ** denotes differences between conditions significant at p<0.05, two-tailed.

