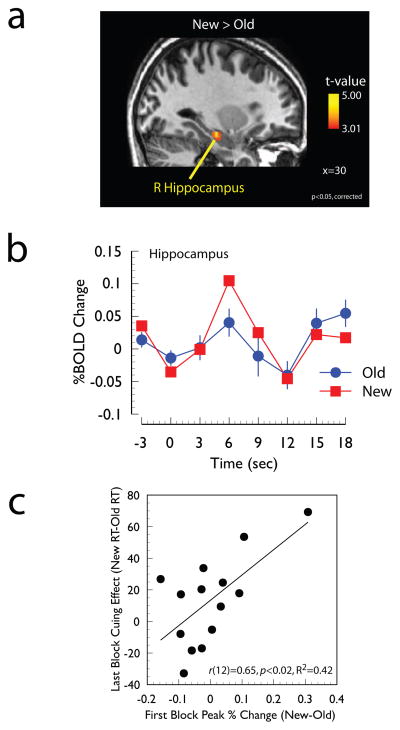
Figure 2. Evidence for modulation of hippocampus responses.
Panel A: Regions of the medial temporal lobe showing a significantly larger response to New displays than Old displays during the last two experimental Epochs (p<0.05, corrected, see Methods). In this and subsequent figures statistical maps are overlaid onto the spatially normalized anatomical image of a single participant. Panel B: Time course of the hemodynamic response at the local maximum (30 −18 −15, see Table 1). Panel C: Scatter plot between individual differences in the magnitude of the differential response to Old and New displays in the first experimental epoch averaged across all voxels shown in the independent statistical contrast shown in Panel A with the magnitude of the contextual cueing effect (ms) in the last experimental epoch.

