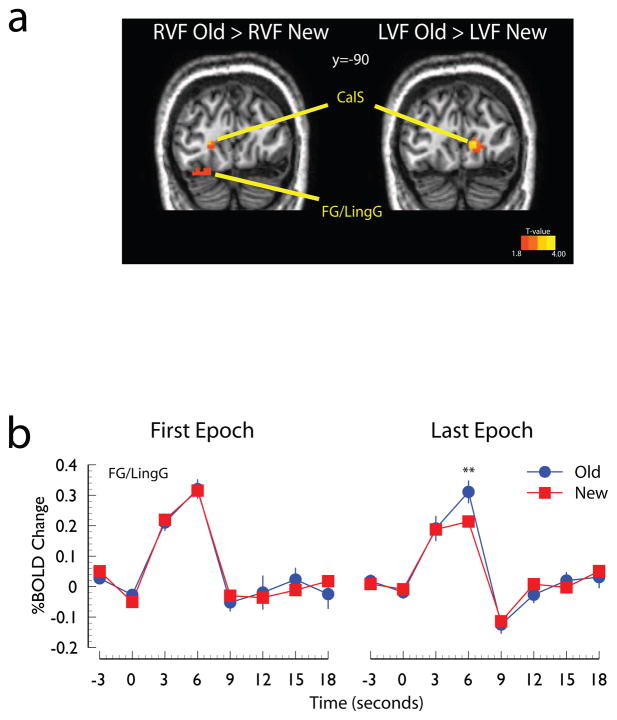
Figure 4. Evidence for modulation of visual cortex responses.
Panel A: Regions of visual cortex showing a larger responses to Old displays than to New displays shown in the right visual field (RVF Old > RVF New) and left visual field (LVF Old > LVF New). This contrast was restricted to regions of visual cortex that exhibited a significant differential response to the lateralized displays (p<0.05, corrected, see Method) and was thresholded at p<0.05, uncorrected. Panel B: Time course of the hemodynamic response to the preferred visual stimulus (i.e., right visual cortex response to left visual field stimuli and left visual cortex response to right visual field stimuli) collapsed across hemisphere. Abbreviations: CalS, calcarine sulcus; LingG, lingual gyrus; FG, fusiform gyrus; R, right; L, left.

