
Fig. 2. Light induced Zn2+ staining and retinal damage were attenuated by ZnR.
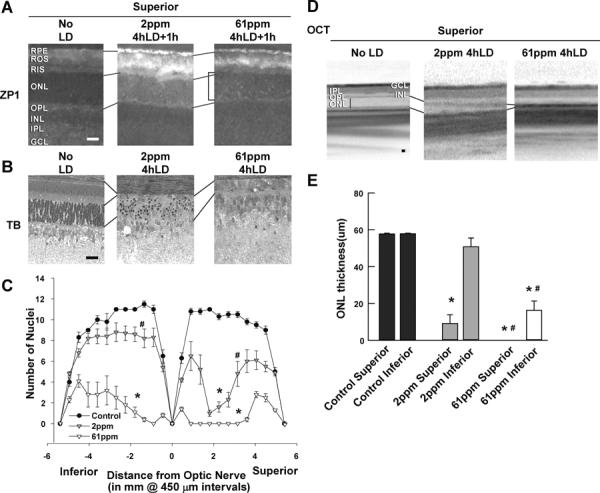
LD was performed on rats fed the diets indicated for 3 wks prior and retinas were analyzed for Zn2+ staining (A) 1h after sham exposure (No LD), or 1 h after 4h of LD. Zn2+ accumulation (white regions) was assessed by ZP1 staining (5 μM for 2 min) in fresh frozen, dried cryostat sections. Representative photomicrographs (n = 4) were taken of the mid superior regions of the retina at 0.2 second exposure. Notice the large increase in the number and intensity of Zn2+ stained cells in superior ONL (brackets) of 61 ppm animals. This is reduced in the 2 ppm animals. B. Retinas of male littermates mice were analyzed 7 days after LD by plastic sectioning cutting from eyes along a superior to inferior meridian encompassing the optic nerve and stained with 0.1% Toluidine Blue. Photomicrographs were taken of the mid superior regions of the retina. C. ONL nuclei counted at increasing distance from the optic nerve was averaged and plotted as a function of distance from the optic nerve for each of the experimental conditions above (n=6). D. Representative ONL images of central superior were taken from OCT; vertical lines show the thickness of the ONL layer. E. The mean thickness of OCT measurement in central superior and inferior hemispheres of the retina in microns is presented ± SEM (n=6). Lines align the RIS or OPL of different panels. Retinal layers are labeled, and the horizontal bars represent 25 microns. * indicates a significant difference from no LD, and # indicates a significant difference from light damage at P < 0.05 by one-way ANOVA and a Student t-test.