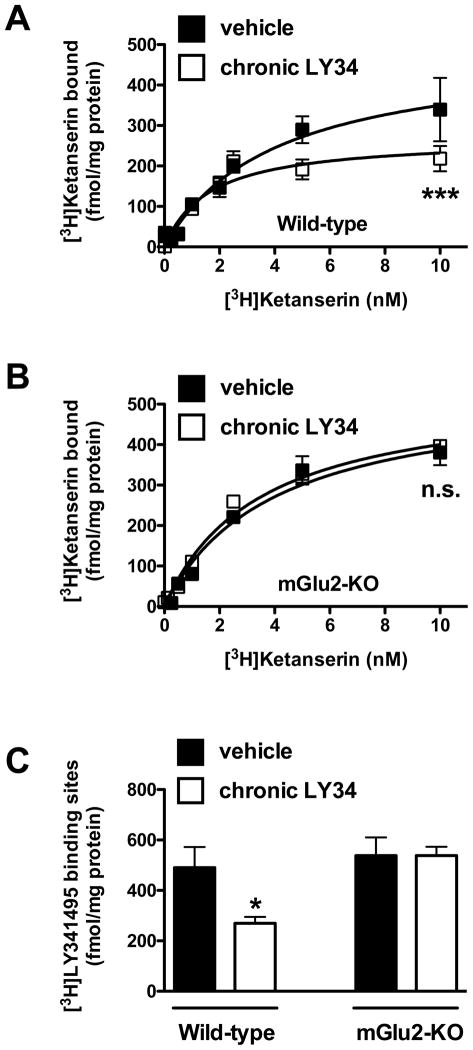
Fig. 2.
(A) [3H]Ketanserin binding saturation curves in somatosensory cortex of wild-type mice one day after chronic treatment with LY341495 (LY34), or vehicle (n = 6). (B) [3H]Ketanserin binding saturation curves in somatosensory cortex of mGlu2-KO mice one day after chronic treatment with LY341495, or vehicle (n = 9). ***p < 0.001, n.s., not-significant; F-test. (C) Maximum number of binding sites (Bmax) for [3H]ketanserin obtained from individual saturation curves. ***p < 0.05; Bonferroni’s post hoc test of two-way ANOVA. Data are mean ± SEM.

