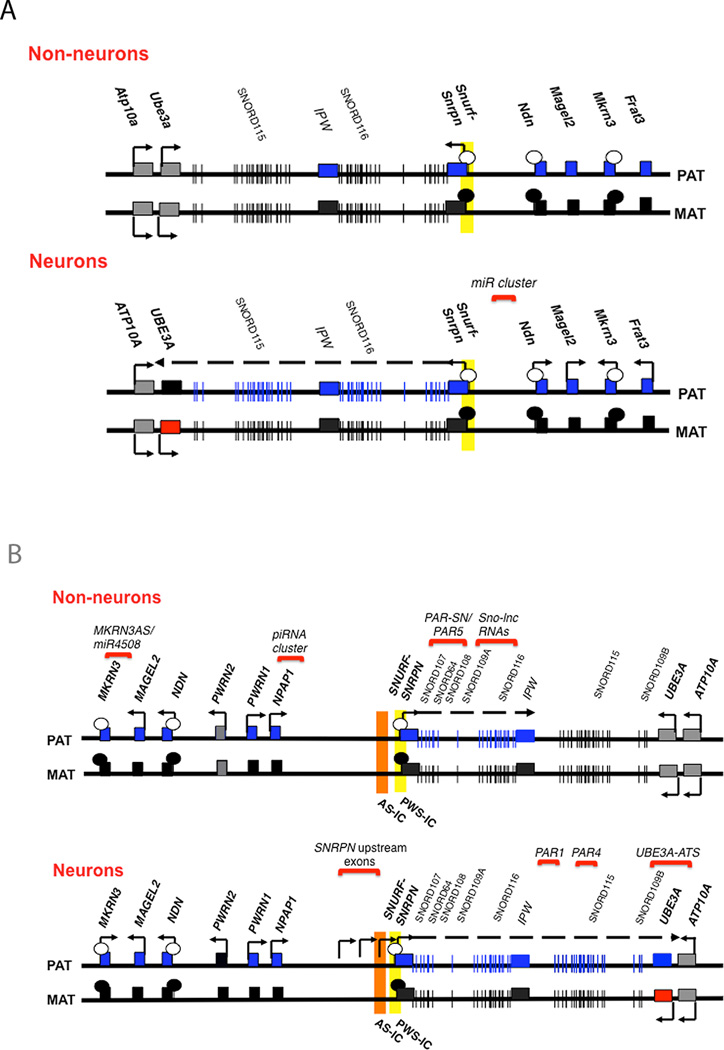
Figure 1. Maps of the human chromosome 15q11-q13 region and the mouse syntenic region on chromosome 7C.
A.) Map of the mouse chromosome 7C region indicating gene expression patterns in non-neurons (top) and neurons (bottom). B.) Map of the human chromosome 15q11-q13 imprinted region indicating gene expression patterns in non-neurons (top) and neurons (bottom). Blue rectangles represent imprinted transcripts that are paternally expressed, red rectangles represent imprinted transcripts that are maternally expressed, black rectangles represent the repressed alleles of imprinted genes, and grey rectangles represent transcripts that are not imprinted. Maps are not to scale and not intended to be all-inclusive.

