
Figure 1.
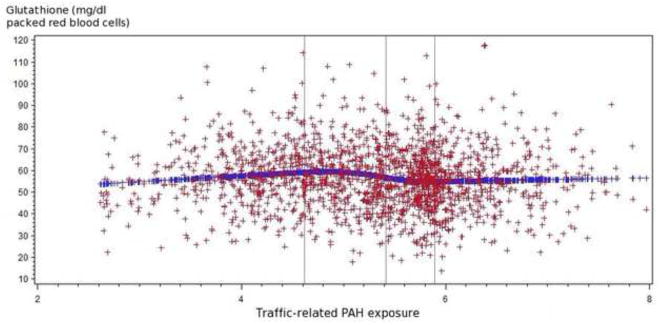
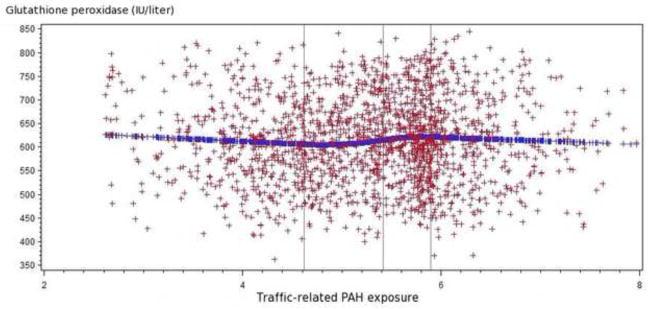
Figure 1.1 Relationship of traffic-related PAH emissions and glutathione levels (mg/dl packed red blood cells) among all participants
Figure 1.2 Relationship of traffic-related PAH emissions and glutathione peroxidase levels (IU/liter) among all participants
The spline regression indicated that higher traffic-related PAH exposure tended to be associated with increased glutathione peroxidase and decreased glutathione.