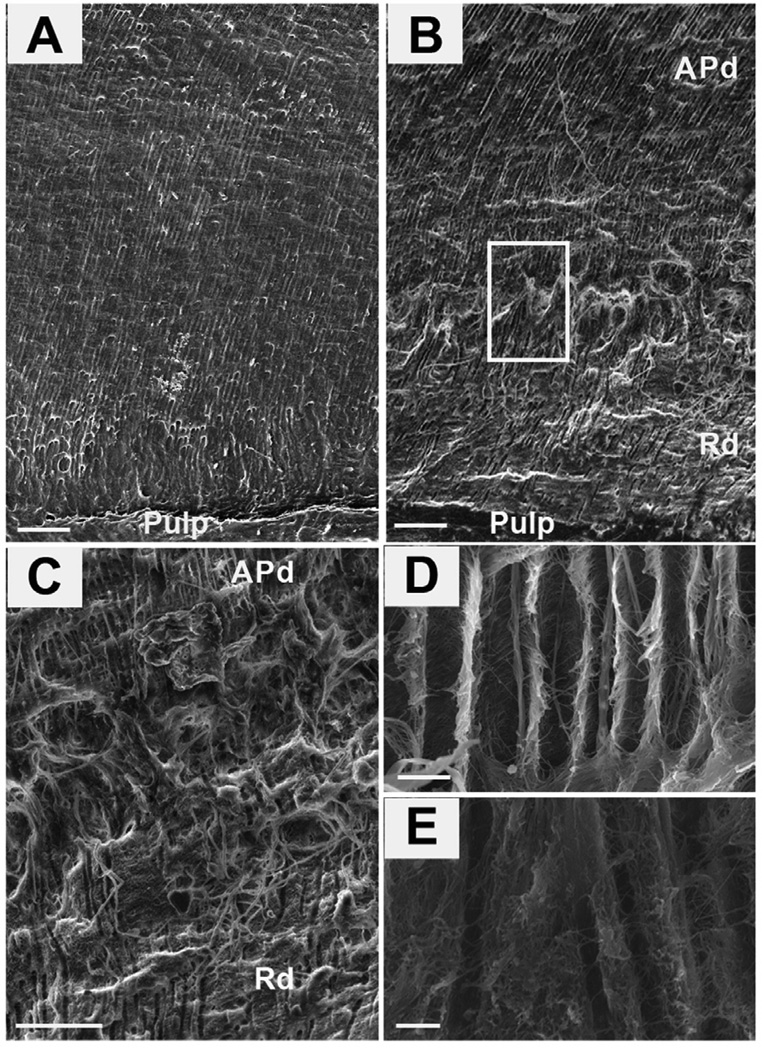
Figure 2. Scanning electron micrographs (SE detector at 10.00 kV) showing the tubular structure of healthy and carious samples.
Reactionary dentin (Rd) displays fewer tubules with constrictions and irregular shapes. (A) A low magnification view (X400) of a fresh fracture of a healthy dentin sample in longitudinal section. Scale bar 20 µm. (B) A low magnification view (X400) of a carious sample reveals the different structure in the area of affected physiological dentin (APd) compared to reactionary dentin (Rd). Scale bar 20 µm. (C) A high magnification view (X1,200) of the boundary between APd and Rd of the boxed area in B. Scale bar 20 µm. (D) A high magnification view (X2,500) of the morphology of Pd. Scale bar 2 µm. (E) A high magnification view (X2,500) of the morphology of Rd. Scale bar 2 µm.

