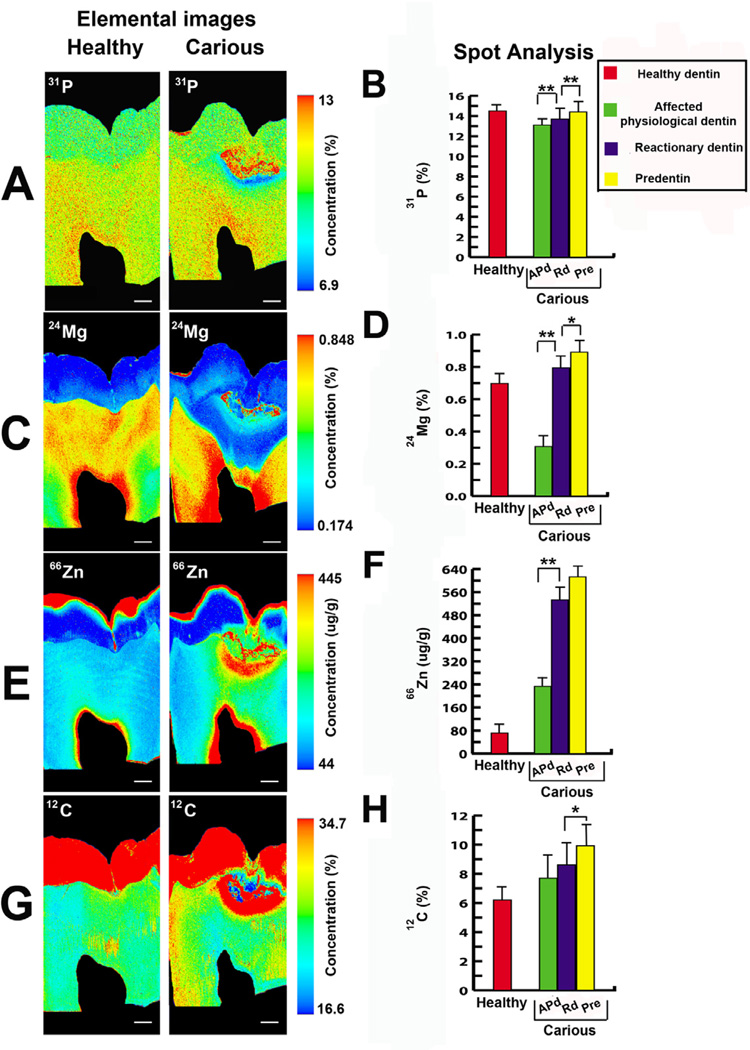
Figure 6. Representative elemental images (31P, 24Mg, 66Zn and 12C) of the areas analysed in healthy and carious samples in longitudinal section by LA-ICP-MS including physiological dentin (Pd), affected physiological dentin (APd), reactionary dentin (Rd) and pre-dentin (Pre).
The bar charts represent quantitative data (31P, 24Mg, 66Zn and 12C) for seven spot analysis of affected physiological dentin (APd), reactionary dentin (Rd) and pre-dentin (Pre) in carious samples and physiological dentin (Pd)in healthy samples. [31P], [24Mg] and [66Zn] were significantly increased in Rd compared to APd. [31P], [24Mg] and [12C] were significantly different between Rd and Pre. All values depict means ± SD. *P ≤ 0.05; ** P ≤ 0.02. (A) Elemental image of [31P] in healthy (first panel) and carious (second panel) samples. In carious samples [31P] gradually increased toward the pulp (n=3 teeth). Scale bar 2 mm. (B) The bar chart presents the significant increase of [31P] in Rd compared to APd and increase in Pre compared to Rd (n=6 teeth). (C) Elemental mapping of the [24Mg] gradient in healthy (first panel) and carious (second panel) samples. In carious samples, [24Mg] decreased in APd under the carious lesion but increased in the area close to the pulp (n=3 teeth). Scale bar 2 mm. (D) The bar chart shows the marked increase of [24Mg] in Rd compared to APd but gradual increase in Pre compared to Rd (n=6 teeth). (E) Elemental images of [66Zn] in healthy (first panel) and carious (second panel) samples. In carious samples, APd under carious lesion shows intense [66Zn] gradient but higher intensity of [66Zn] was found close to the pulp (n=3 teeth). Scale bar 2 mm. (F) The bar chart reveals the significant increase of [66Zn] in Rd compared to APd (n=6 teeth). (G) Elemental images of [12C] in healthy (first panel) and carious (second panel) samples (n=3 teeth). Scale bar 2 mm. (H) The bar chart shows high variation of [12C] in APd of carious sample. The difference was not significant between APd and Rd. However, the difference in [12C] content in Pre and Rd was significant (n=6 teeth).

