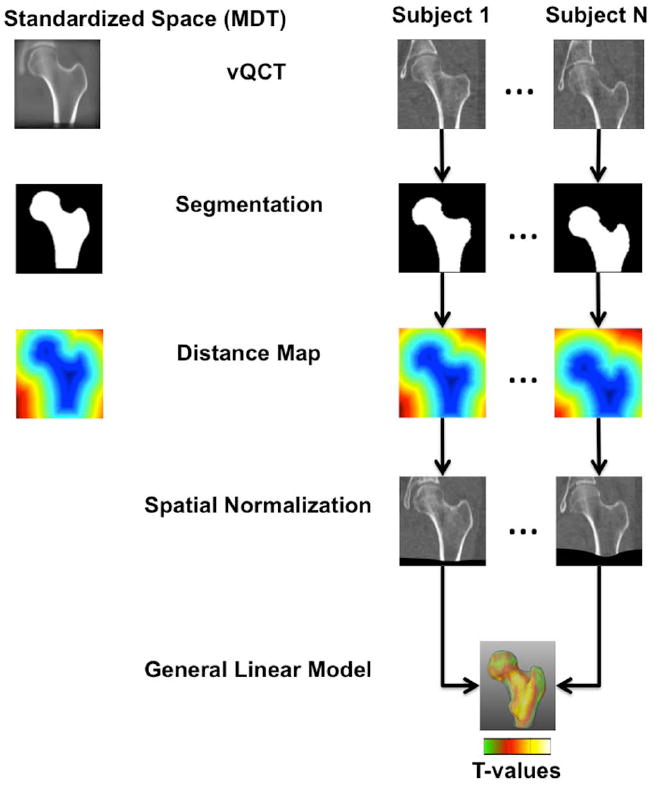
Figure 1.

Flow diagram illustrating the steps of the adapted VBM technique used in this study. All images were segmented and femoral shapes were represented as distance maps. Using the distance maps, all scans in the study were spatially normalized to a standardized space (MDT). Aligned vBMD images were smoothed and groups were compared using a general linear model approach generating T-maps.
