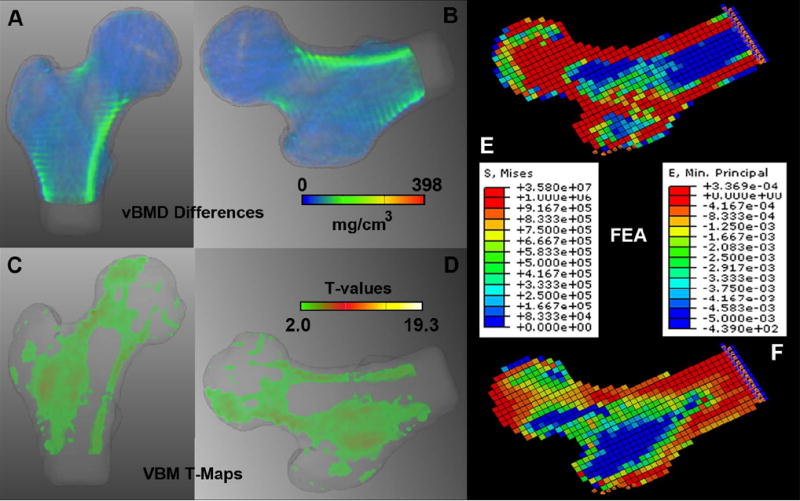
Figure 4.

Spatial distribution of vBMD changes associated with incident hip fracture. (A) Anterior view of a volumetric representation of voxel-wise vBMD differences between older Icelandic control (n=148) and fracture (n=74) women (0-223 mg/cm3). (B) Rotated version of A simulating a posterolateral fall. Color-coding and transparency were standardized to a dynamic range of 0-398 mg/cm3 as in Figures 3A-C. (C) Mid-coronal cross-section of the T-map of the voxel-wise vBMD differences between older Icelandic control (n=148) and fracture (n=74) women (2.3-6.9 T-values). (D) Rotated version of C simulating a posterolateral fall. Voxels were assigned transparency based on their T-values, from full transparency for non-significant voxels (T<2·3), to full opacity for T-values=19.3 as in Figures 3D-E. (E) FEM posterolateral fall loading von Mises stress map of a representative woman with incident hip fracture. (F) FEM posterolateral fall loading principal strain map of the same representative woman with incident hip fracture. FEA = Finite Element Analysis.
