Figure 2.

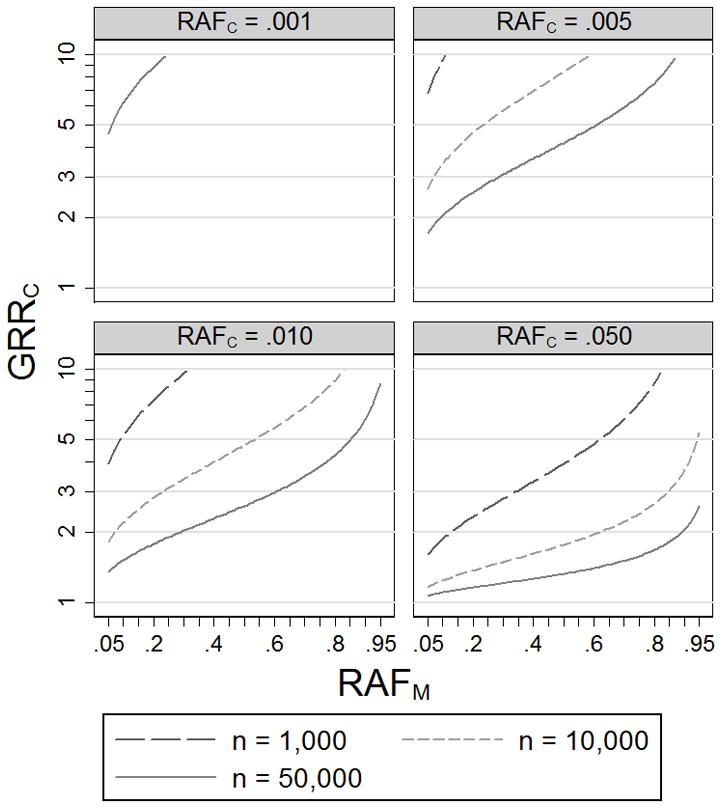
Genotype relative risks at causal variant C (GRRC) that result in 5% power to detect association (p < 5×10⁻⁸) at genotyped variant M using n cases and n controls. We assume disease prevalence 10% and D′ = 1 between M and C.

Genotype relative risks at causal variant C (GRRC) that result in 5% power to detect association (p < 5×10⁻⁸) at genotyped variant M using n cases and n controls. We assume disease prevalence 10% and D′ = 1 between M and C.