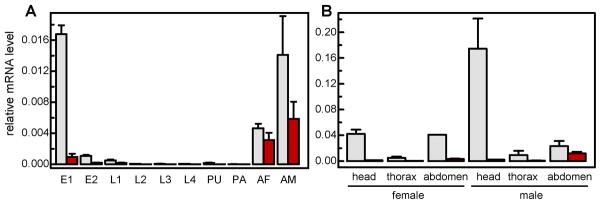
Fig. 6. Transcript levels of A. gambiae AChE1 (light bar) and AChE2 (dark bar) at different developmental stages (A) and in three body parts (B).

Total RNA samples were isolated from <14 h (E1) and 14–40 h (E2) eggs, 1st instar (L1), 2nd instar (L2), 3rd instar (L3), and 4th instar (L4) larvae, pupae (PU), pharate adults (PA), day 4 adult females (AF) and males (AM), heads, thorax, and abdomens of adult females and males. The ace-1 and ace-2 mRNA levels were analyzed by qRT-PCR as described in Section 2.8. Normalization of cDNA templates was performed by using actin as an internal standard according to (1+Eactin) Ct, actin/(1+Eace) Ct, ace. Note that the ace transcript levels were much lower than the actin control (set at 1.00 for all samples).
