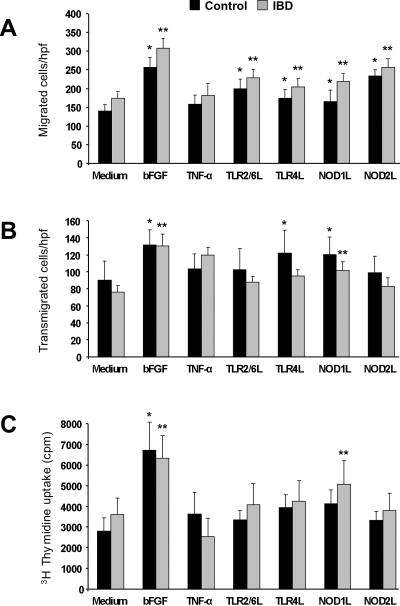
Figure 1.
A) TLR and NLR activation-induced HIMEC migration
Wounded control and IBD HIMEC monolayers were exposed to optimal stimulatory doses of bFGF, TNF-α and TLR2/6L, TLR4L, NOD1 and NOD2 ligands, and migrated cells counted after 24 h. *p<0.04–0.01 for stimulated vs unstimulated (medium) control HIMEC; **p<0.02–0.002 for stimulated vs unstimulated (medium) IBD HIMEC (n=10 and 14 for control and IBD HIMEC, respectively); L: ligand; hpf: high power field.
B) TLR and NLR activation-induced HIMEC transmigration
Control and IBD HIMEC were place in the upper compartment of a Boyden chamber, optimal stimulatory doses of bFGF, TNF-α and TLR2/6L, TLR4L, NOD1 and NOD2 ligands were placed in the lower compartment, and the number of transmigrated cells counted after 8 h. *p<0.03–0.01 for stimulated vs unstimulated (medium) control HIMEC; **p<0.01 for stimulated vs unstimulated (medium) IBD HIMEC (n=8 for both control and IBD HIMEC).
C) TLR and NLR activation-induced HIMEC proliferation
Control and IBD HIMEC monolayers were exposed to optimal stimulatory doses of bFGF, TNF-α and TLR2/6L, TLR4L, NOD1 and NOD2 ligands, and proliferation assessed by 3H thymidine uptake after 24 h. *p<0.001 for stimulated vs unstimulated (medium) control HIMEC; **p<0.01–0.001 for stimulated vs unstimulated IBD HIMEC (n=10 and 11 for control and IBD HIMEC, respectively).

