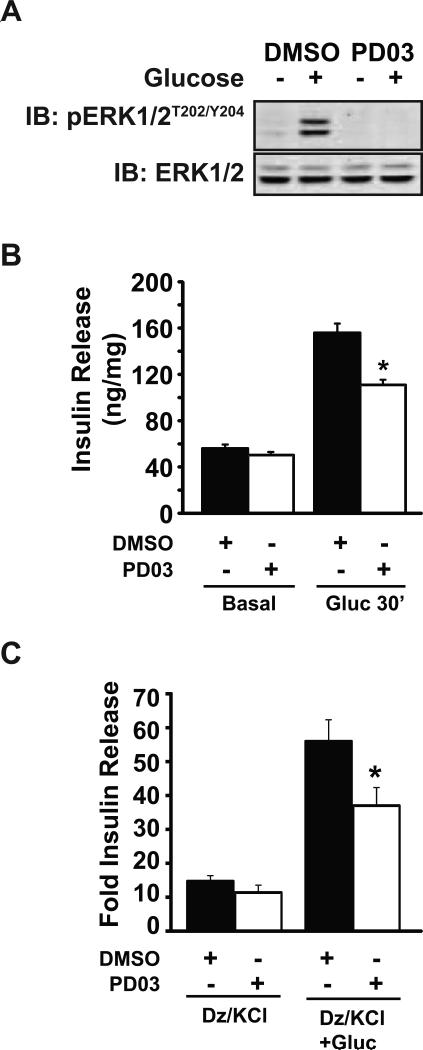
Figure 4. ERK1/2 signaling contributes to the amplification/sustained phase of insulin release.
A) MIN6 cells were preincubated for 1 h in MKRBB, and either vehicle (DMSO) or 1 μM PD03 was added to the buffer for 1 h prior to stimulation with 20 mM glucose for 30 min. Lysates were subjected to SDS-PAGE and immunoblotting (IB) for phosphorylated and total ERK1/2. Data are representative of three independent experiments. B) Insulin secreted into the buffer in (A) was quantified by RIA and normalized for protein content corresponding to each accompanying cell lysate; *P<0.05, versus glucose-stimulated vehicle. C) MIN6 cells treated as described for (A) were exposed to 250 μM diazoxide (Dz) for 10 min before stimulation with 35 mM KCl (Dz/KCl) or 35 mM KCl plus 20 mM glucose (Dz/KCl+Gluc) for 30 min. Supernatants were collected for insulin radioimmunoassay. Insulin secreted in three independent experiments was quantified by RIA and normalized for protein content corresponding to each accompanying cell lysate. Data are shown as the stimulation index (SI=stimulated insulin release/unstimulated) for each independent experiment; *P<0.05, versus glucose-stimulated vehicle cells.

