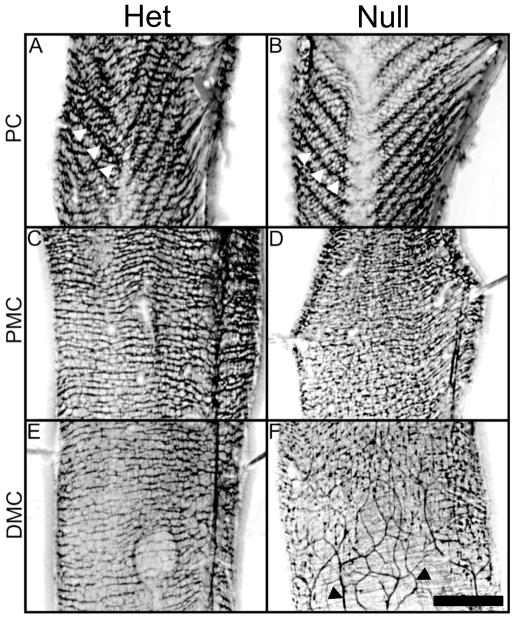
Figure 2.
Micrographs made with a fluorescent dissecting microscope showing higher magnifications of portions of Figure 1. A, C, and E show P21 Ednrb het preparations and B, D, and F are Ednrb null. In the proximal colon (PC), (A and B), submucosal ganglia are arranged in a “V” shaped pattern (white arrowheads, see also Supplementary Fig. 1) while the myenteric ganglia appear as fine lines arranged horizontally across the width of the gut. Proximal mid-colon (PMC) of Ednrb het (C), and null (D) show similar patterns and density. Note that myenteric and submucosal ganglia cannot be distinguished from each other in these micrographs. Distal mid-colon (DMC) of Ednrb het (E) and null (F). Ganglia in the DMC are apparent in the Ednrb het but are reduced in number in the null. F shows the TZ and beginning of the aganglionic region in which sacral-derived nerve fascicles can be seen (black arrowheads). Scale bar = 2 mm.

