Figure 4.

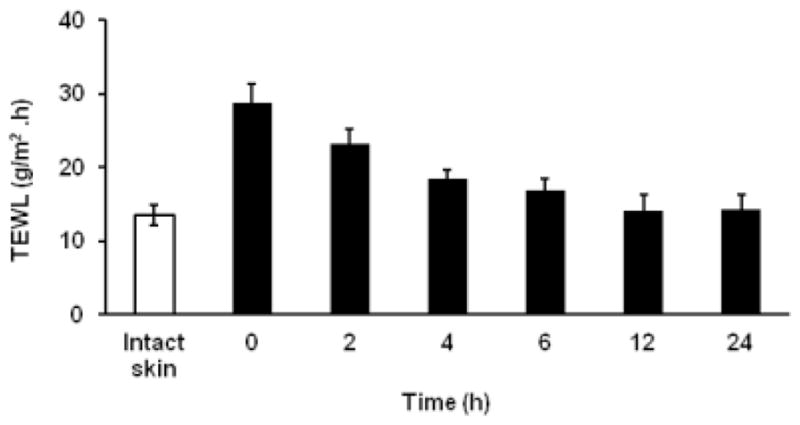
The In vivo TEWL measurements after microporation at different time points. The unfilled bar (□) represents the TEWL of intact skin before microporation. The data points represented are the average of n= 6 ± S.D.

The In vivo TEWL measurements after microporation at different time points. The unfilled bar (□) represents the TEWL of intact skin before microporation. The data points represented are the average of n= 6 ± S.D.