Figure 5.
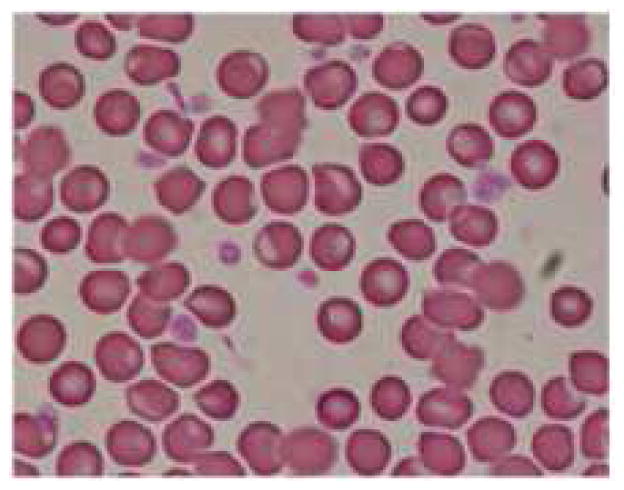
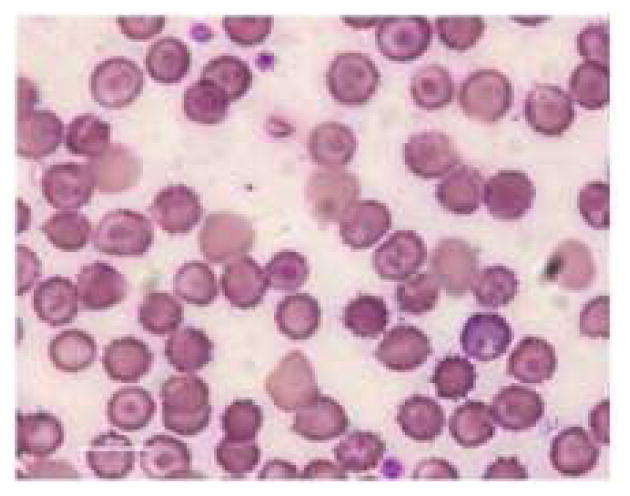
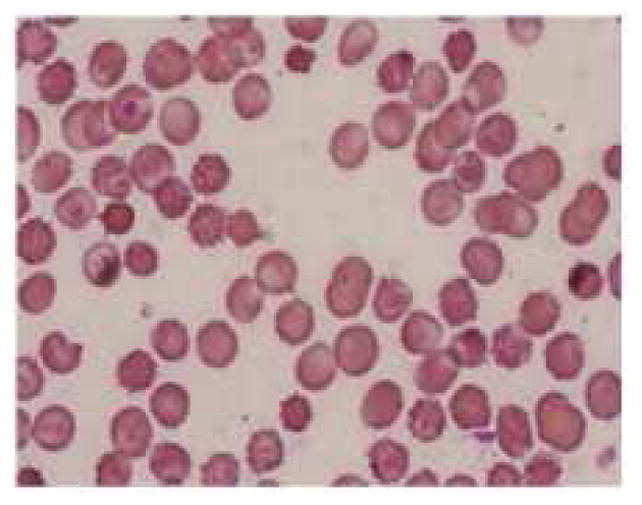
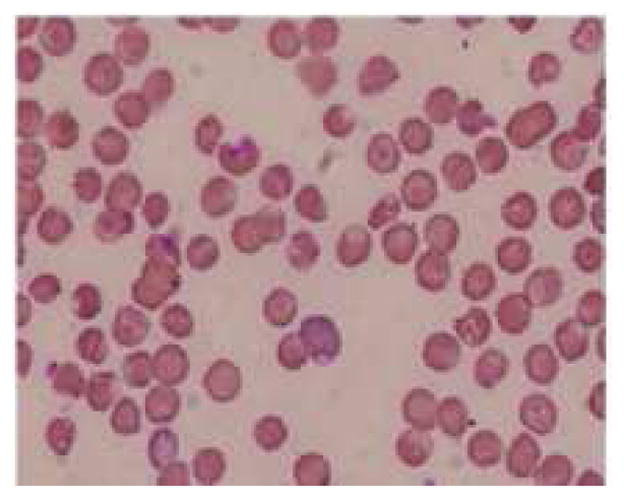
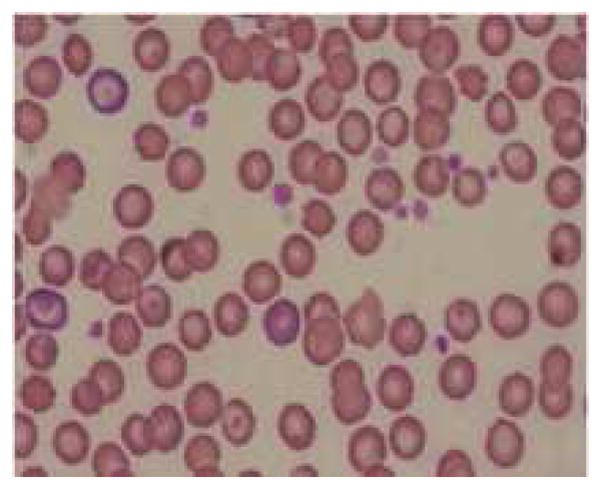
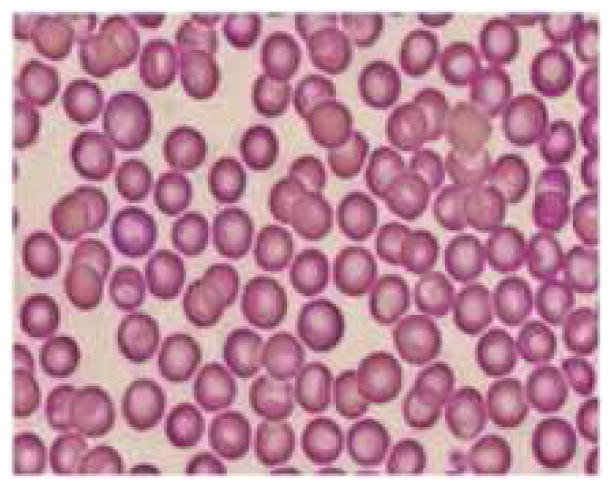
Representative pictures of morphology of RBCs (a) RBCs in healthy rats (b) RBCs of anemic rats (Microcytic and hypochromic RBC shown with ↑ marks) (c) RBCs in group 3 administered with FPP by iontophoresis (IN) (d) RBCs in rats administered with FPP following microneedle (MN) pretreatment (group 4) (e) RBCs of the rats administered with FPP using combination of iontophoresis and microneedle pretreatment (MN+IN) (group 5) and (f) RBCs of rats that received FPP through IP injection (group 6).
