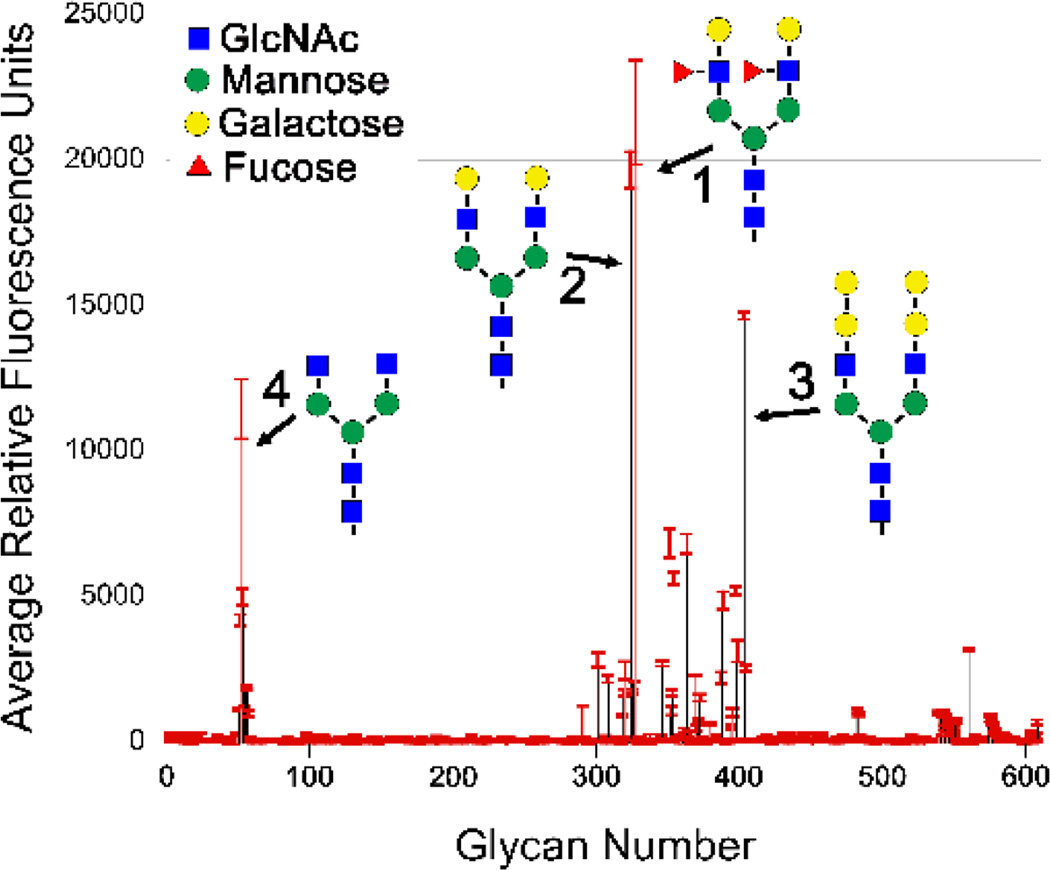
Figure 4.
VCC glycan screen results. Purified VCC was labeled with Alexa Fluor 488 and screened against an array of 611 mammalian glycans by the Consortium for Functional Glycomics. The average fluorescence of VCC binding to each glycan is shown with red error bars indicating the standard deviation from four replicates (after the highest and lowest replicates were dropped). The top four hits are illustrated in schematic form and all contain a bi-antennary N-glycan heptasaccharide core. A detailed list of the 25 top hits is shown in Supplementary Figure S5 and variants of the top hits that exhibited low binding is shown in Figure S6.

