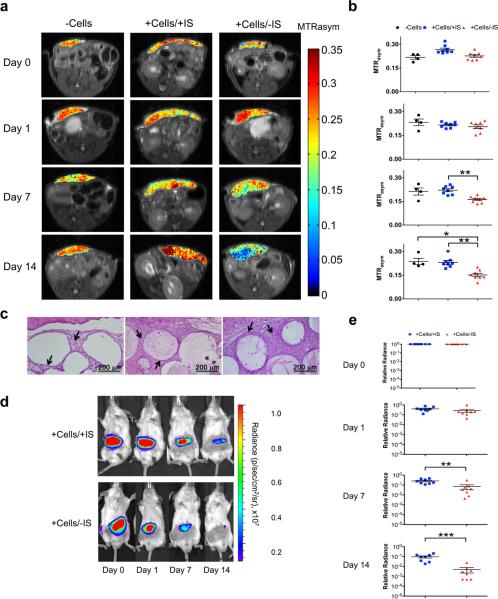
Figure 6. In vivo CEST and BL imaging of LipoCEST capsules containing hepatocytes.
Balb/c mice were s.c. transplanted with 2,500 empty LipoCEST capsules (−Cells), with LipoCEST capsules containing Luc-transfected hepatocytes while receiving immunosuppression (+Cells/+IS), and with capsules containing cells but no immunosuppression (+Cells/−IS). a, CEST/MTw overlays using a frequency offset of 2 ppm at day 0, 1, 7, and 14 after transplantation; b, average MTRasym values for the −Cells (n=4, black), +Cells/+IS (n=8, blue), and +Cells/−IS (n=8, red). c, H&E stain of the s.c. transplant site for −Cells (left), +Cells/+IS (middle), and +Cells/−IS (right). Arrows outline dense layers of surrounding host cells; animals without immunosuppression (right) show the strongest host immune response. d, BL images of the same animals in panel a. e, BLI relative radiance for the 2 groups of mice with encapsulated hepatocytes over a time course of 2 weeks. (*P<0.05, **P<0.01, ***P<0.001).

