
Fig. 4.
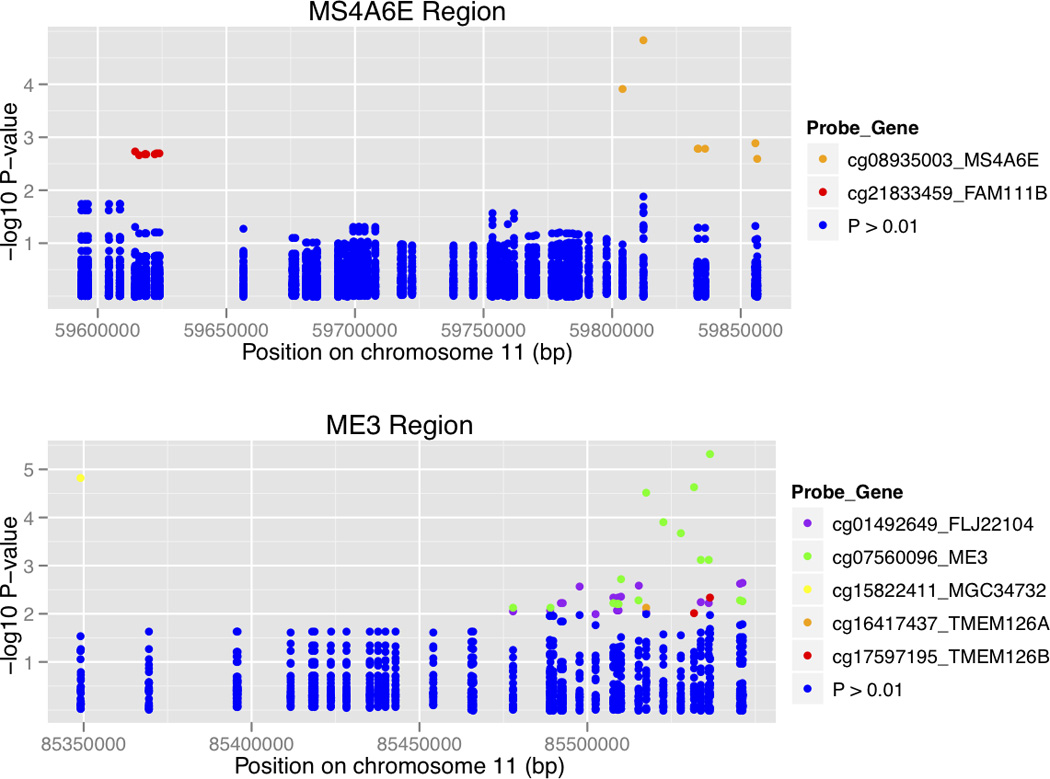
Association between genotypes and CpG sites in cerebellum. Here the results are shown as log-transformed P values color-coded to match the CpG probe in the loci. The regions associated in chromosome 11 are represented: in the top panel the MS4A6E locus and in the bottom panel the ME3 region. From these, only rs10897024 in PICALM (associated with a p-value of 4.65×10⁻⁶ with the probe cg07560096 in ME3, represented in green) is in moderate LD with the GWAS hits for PICALM (rs561655, rs3851179 and rs541458).