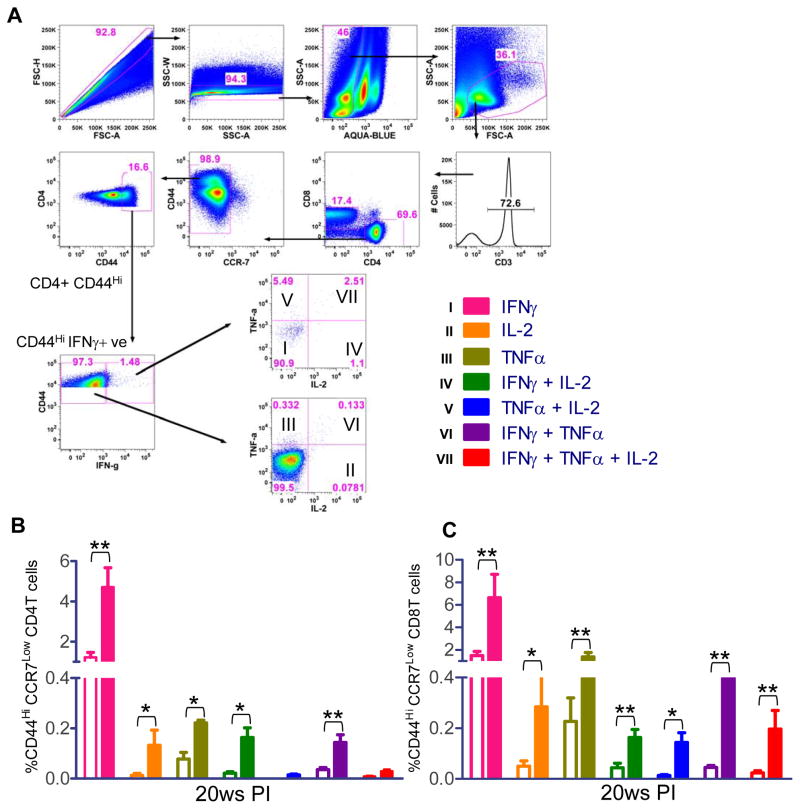
Figure 6.
Multiparameter flow cytometry based analysis for single, double or triple cytokine secreting CD44HI/CCR7Low CD4 or CD8 T cells. (A) The common gating steps shown in this study. (B) Spleen cells of 20 weeks post-immunized mice were stimulated with FTAg for 48 hrs and stained with various antibodies as described in Materials & Methods. Antigen experienced effector cells were gated and divided into seven distinct subpopulations and the frequencies of the various subpopulations were calculated. Open bars represent naïve mice and solid color bars represent immunized mice. The data presented are representative of two experiments with similar results and 4–5 mice in each group. Mean and SEM of four mice in each group are shown. *, p< 0.05; **, p< 0.01

