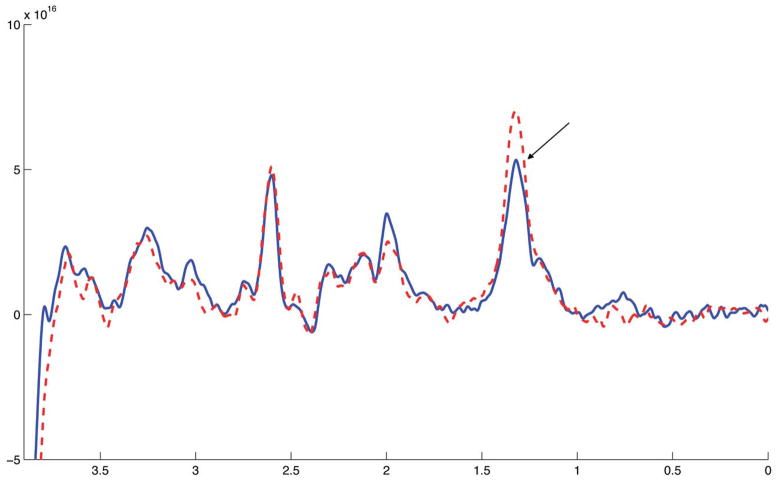
Figure 2.
Two edited-spectra obtained during one session in one volunteer, with the location of the lactate peak indicated (1.33 ppm). No apodization has been applied but the spectra have been realigned at the NAA peak to account for scanner drift. The different line styles indicate different phases of the protocol, the solid line was acquired from the baseline normoxia phase and the dashed line was acquired during hypoxia. Each spectrum arises from 200 s worth of data and consists of 100 transients.

