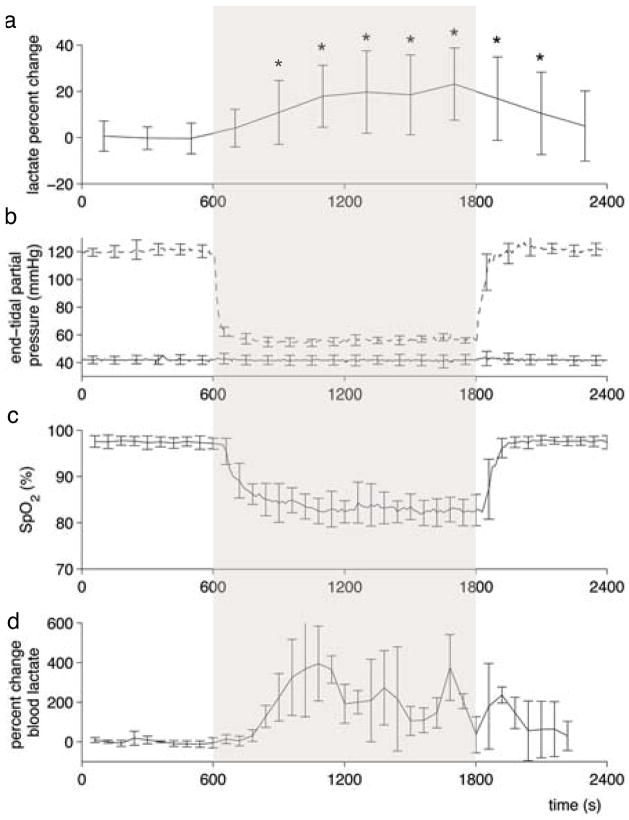
Figure 3.
Average time-resolved physiological measurements. Lactate concentration change during the hypoxic challenge relative to the baseline mean, is averaged across all subjects in (a) where * indicates lactate concentration is significantly different from baseline according to the general linear model analysis. Plots of end-tidal CO2 (solid line) and O2 (dashed line) in (b) and oxygen saturation (c) averaged across all experiments. In a separate session, blood lactate was measured to assess systemic lactate during hypoxia (d).

