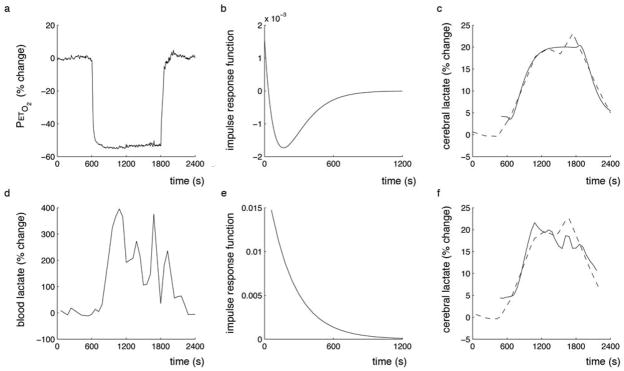
Figure 5.

Hypoxia impulse response function for cerebral lactate. (a) End-tidal O2 was used as the system input and the impulse response function (b) was calculated. The impulse response is used to predict the lactate response (c, solid line) modelled from the experimental data (c, dashed line). Similarly, (d) blood lactate was used as the system input and the impulse response function (e) calculated. The blood lactate response function is also used to predict the cerebral lactate response (f, solid line) modelled from the experimental data (f, dashed line). The slight differences in appearance of the experimental lactate data is a result of different levels of interpolation required to generate the impulse response function as PetO2 and blood lactate sampling rates were different.
