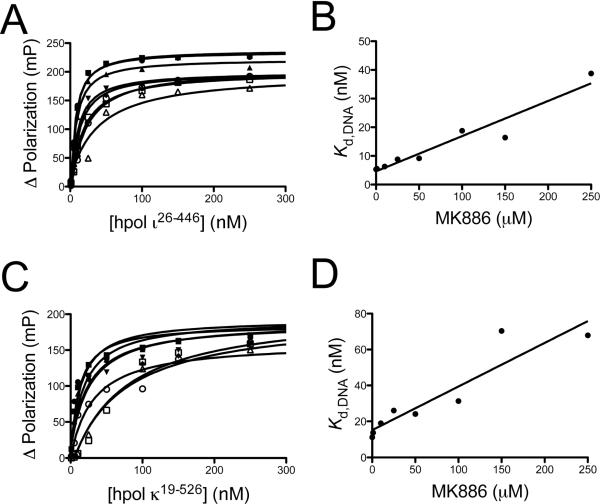
Figure 3.
The effect of MK886 upon DNA binding by Y-family DNA polymerases is slightly more pronounced for hpol κ19–526 than hpol ι26–446. A. Fluorescein-labeled primer-template DNA (FAM-13/18mer; 2 nM) was incubated with increasing concentrations of hpol ι26–446 and the change in fluorescence polarization was measured. The experiment was repeated in the presence of increasing concentrations of MK886 (1 μM to 250 μM). B. The measured equilibrium dissociation constants (Kd,DNA) determined in panel A were re-plotted as a function of MK886 concentration. The data was fit to a linear equation and the slope used as a measure of MK886 inhibition of polymerase binding to DNA. C. Fluorescein-labeled primer-template DNA (FAM-13/18mer; 2 nM) was incubated with increasing concentrations of hpol κ19–526 and the change in fluorescence polarization was measured. The experiment was repeated in the presence of increasing concentrations of MK886 (1 μM to 250 μM). D. The measured equilibrium dissociation constants (Kd,DNA) deterimined in panel C were re-plotted as a function of MK886 concentration. The data was fit to a linear equation and the slope used as a measure of MK886 inhibition of polymerase binding to DNA.

